Here we'll look at different configuration options for a widget showing a KPI tile
For more info about setting up the Dashboard and different Widgets, check out this article:
Creating a dashboard and adding widgets
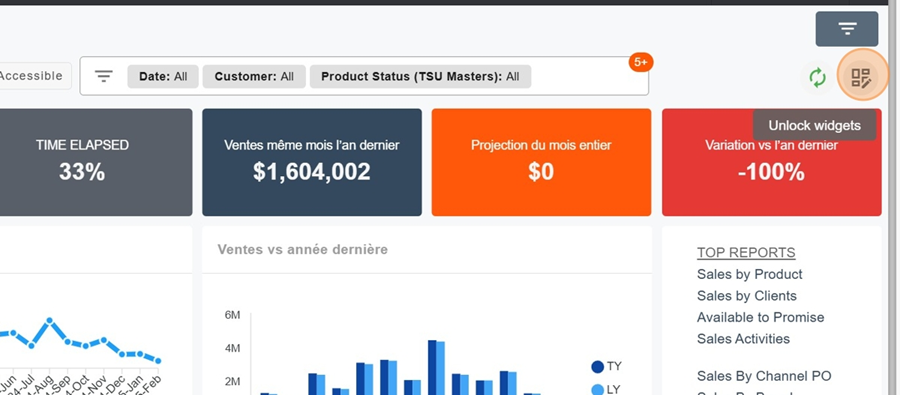
To add a widget, first click on the squares icon at the top right of the screen
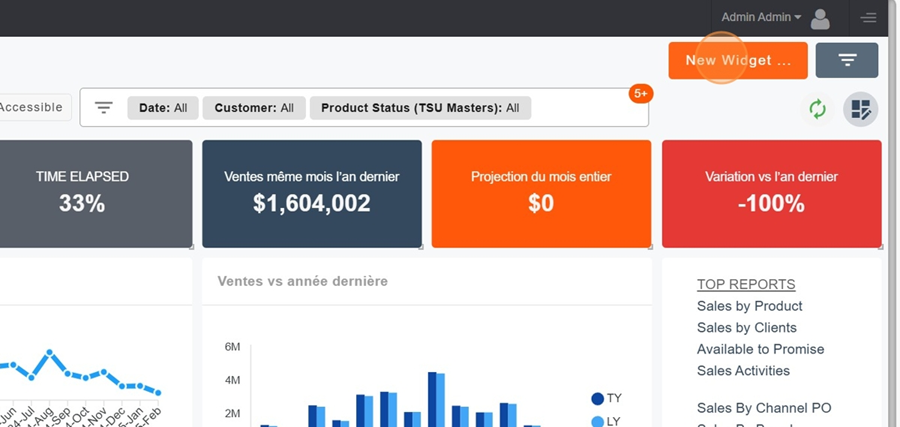
Then click on the orange box New Widget
Name your Widget.
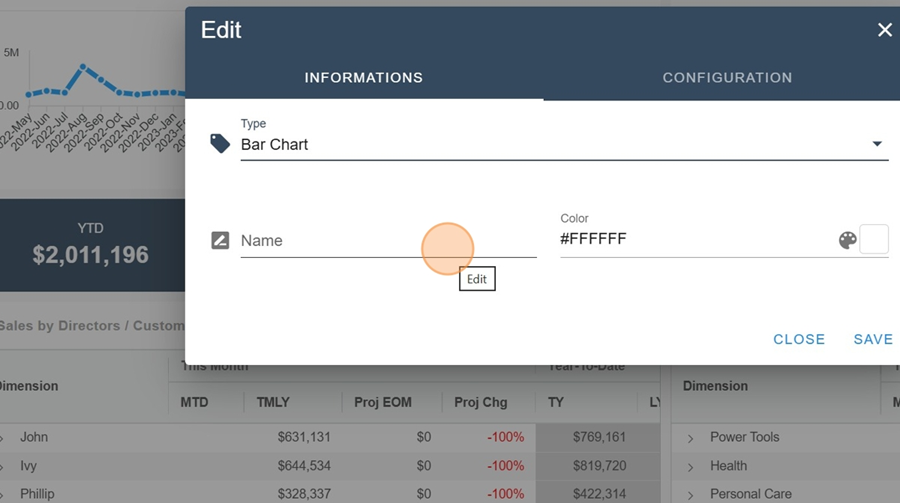
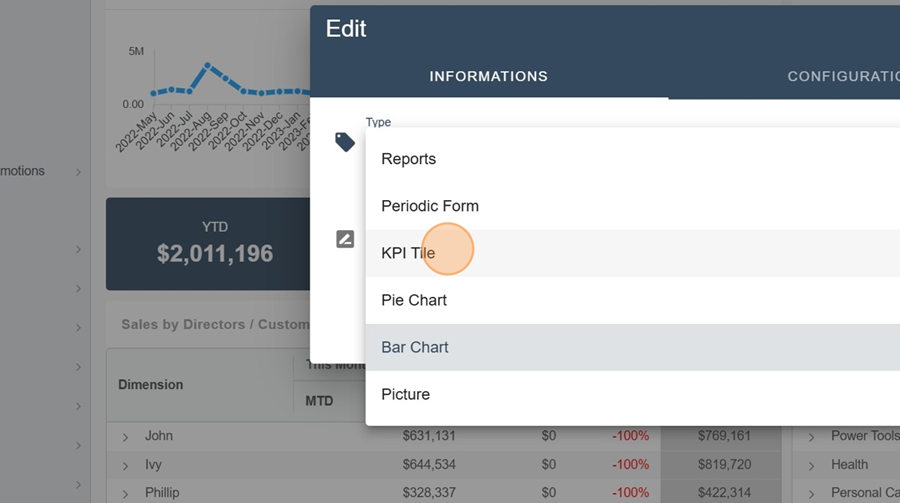
Pick The KPI Tile Type
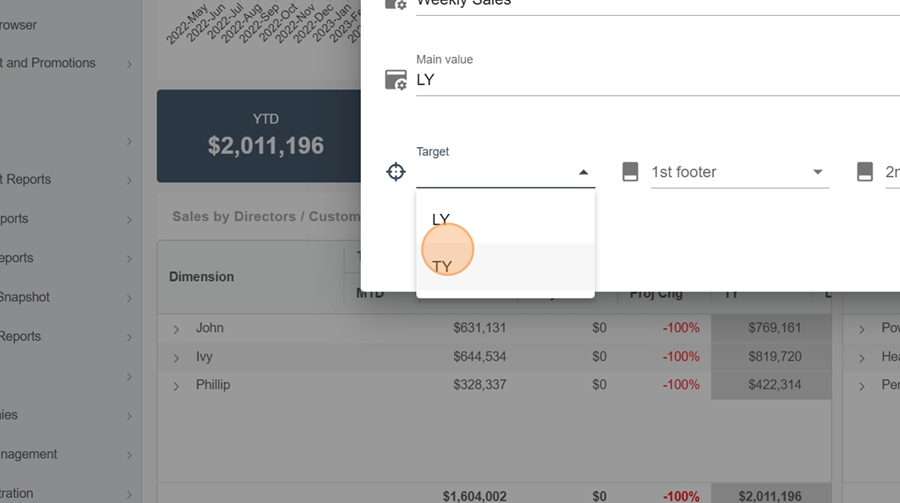
First pick the view, main value and the target
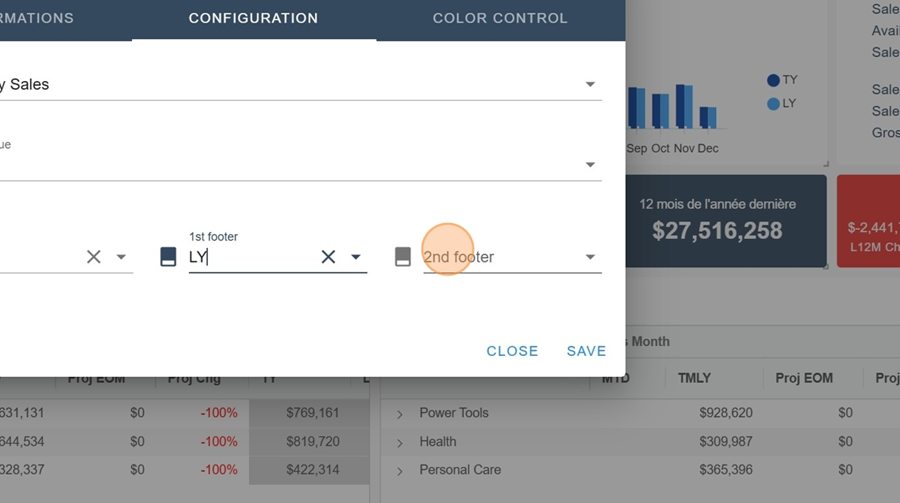
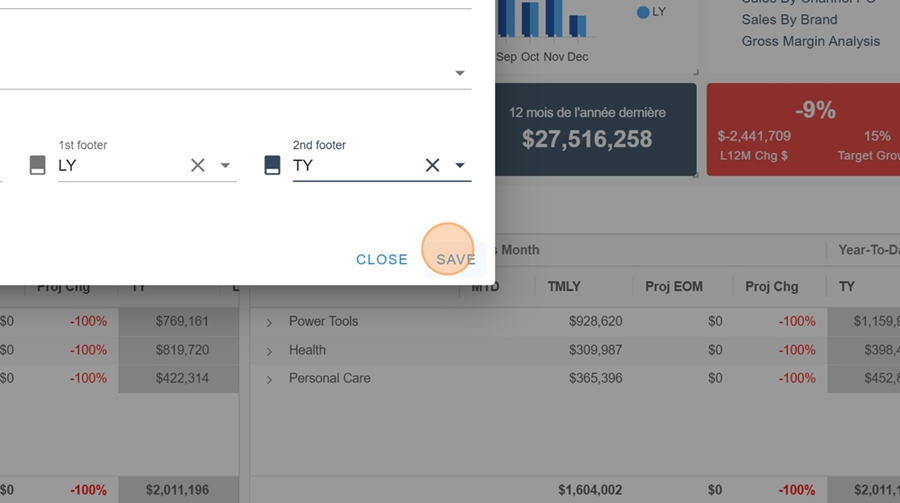
The first footer is for the info on the left and the second one is for the info on the right (Note: You don't have to fill every field when setting it up. They're all optional, except for the main value)
Click save
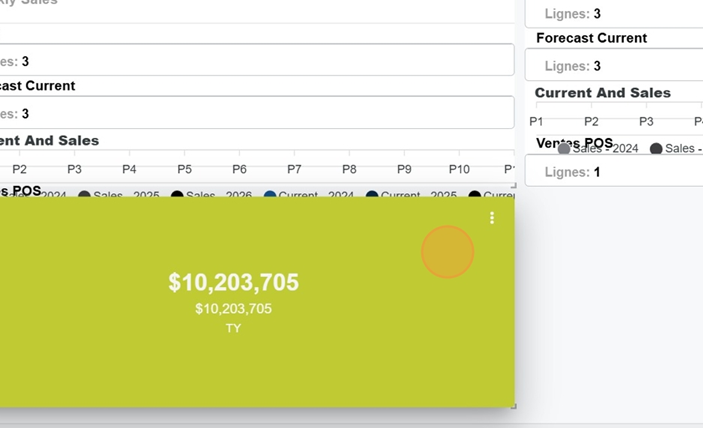
Now you can check your Widget
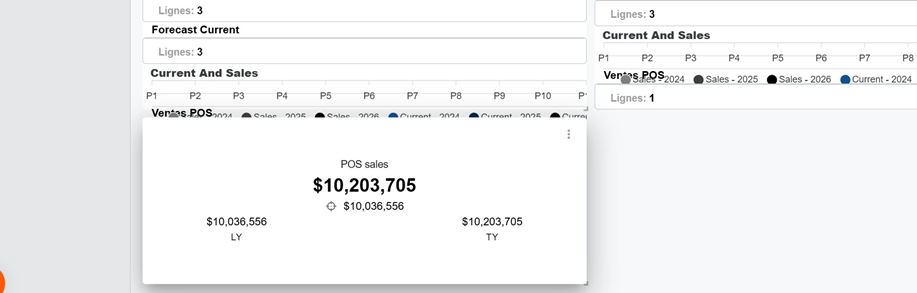
There are two ways to add colors to your KPI Tile
In the information section, you can pick a background color for your Widget
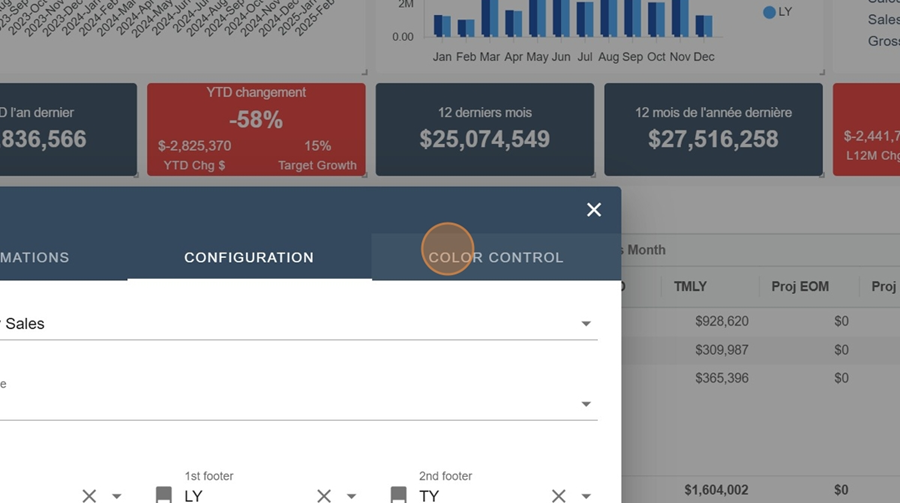
The Color Control section also lets you make a selection
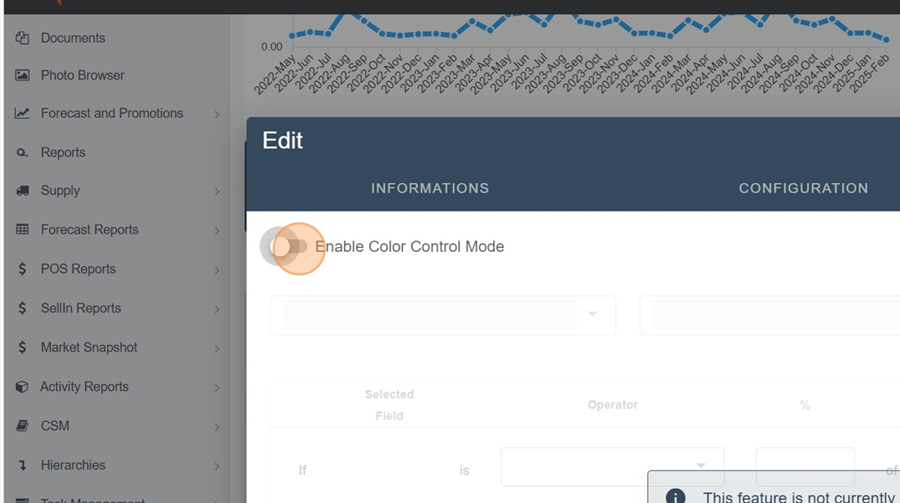
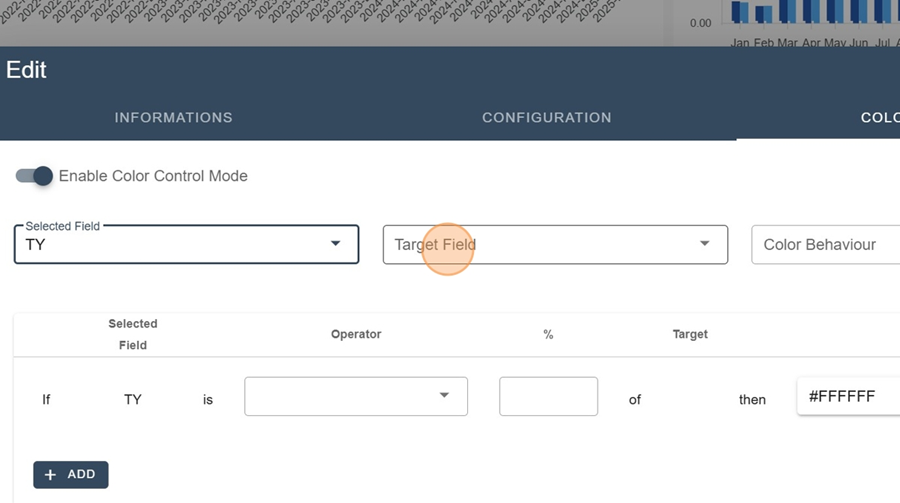
First turn on the color control mode at the top left
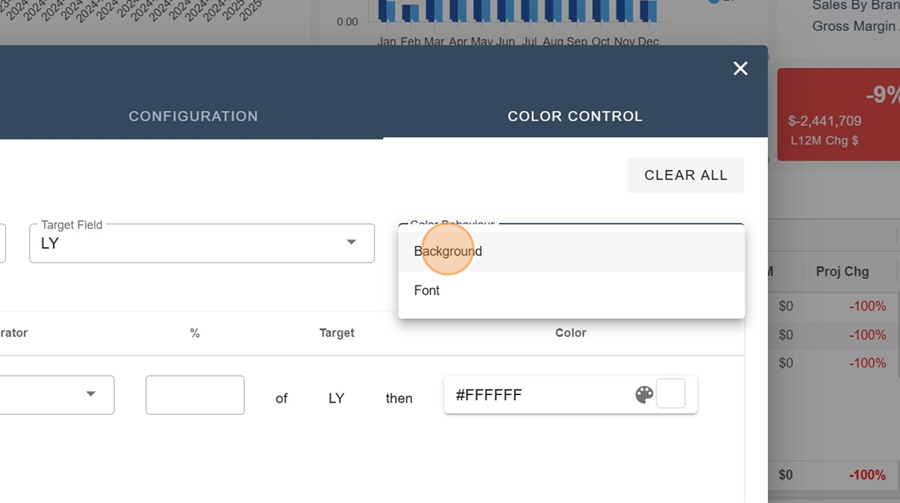
Indicate selected field and the target field
Choose if you want to see the background or the text color change
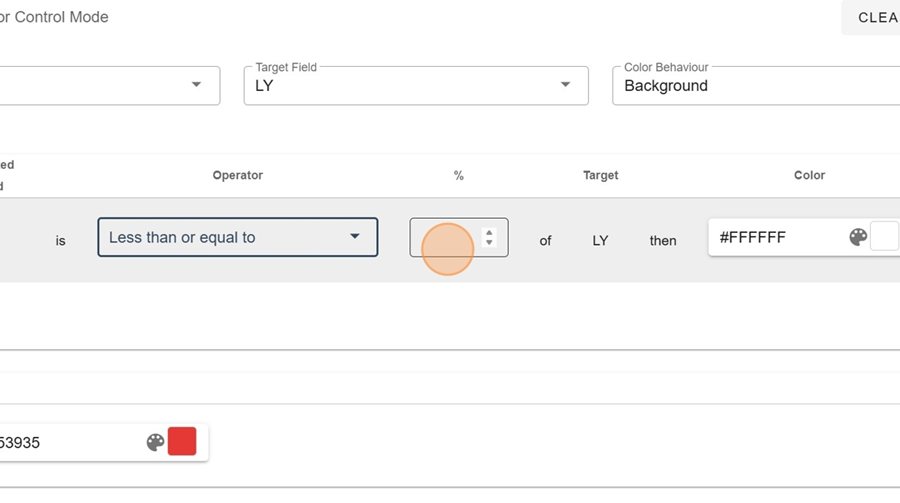
Next, pick the settings. For example, here we want all TY values less than or equal to 100% to show in a certain color
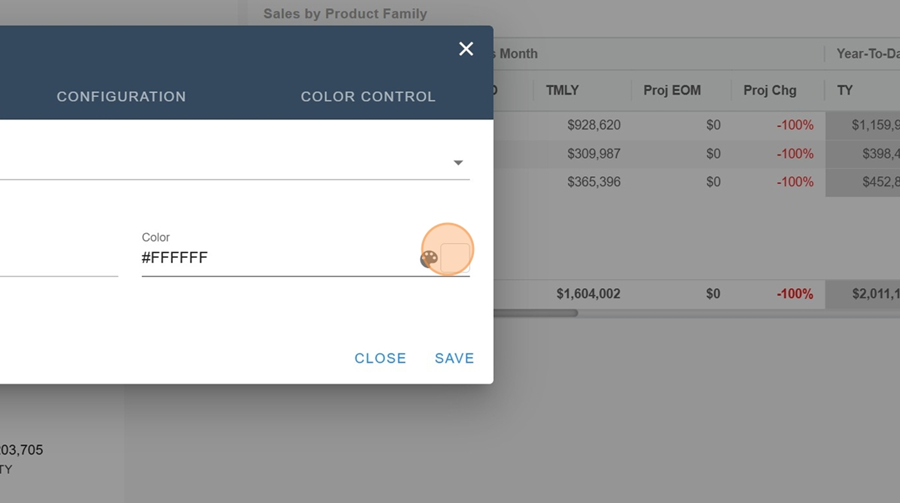
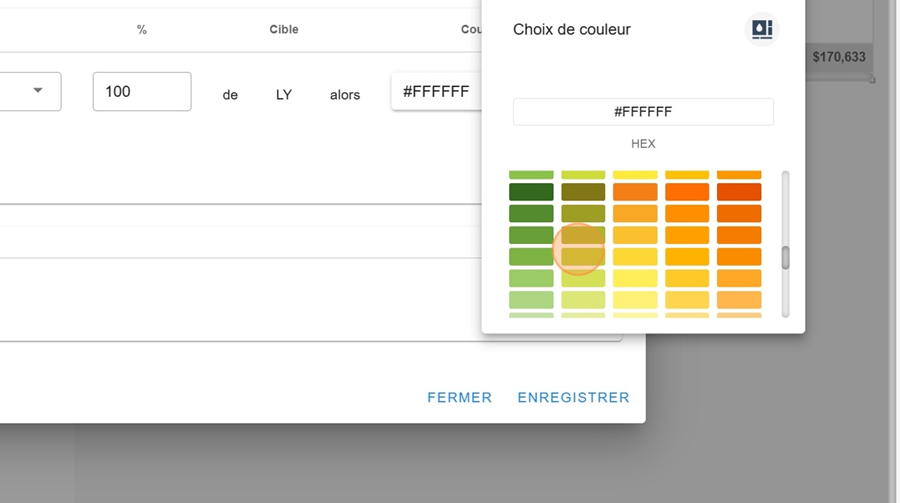
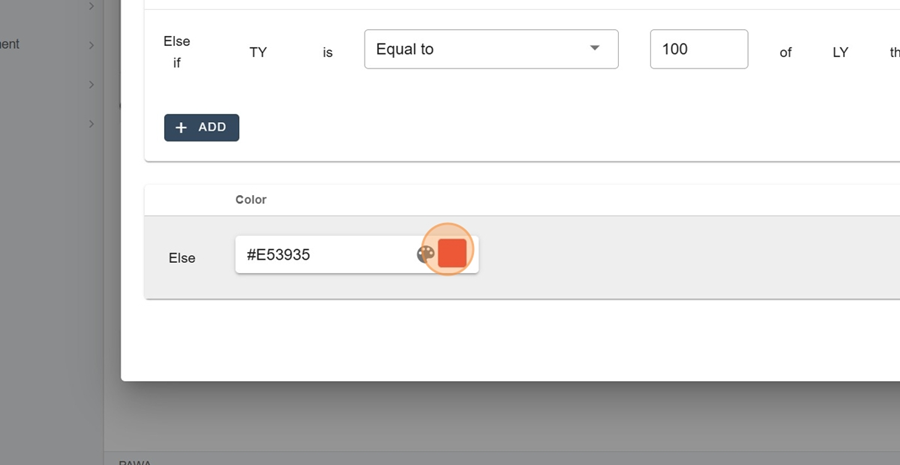
Pick your color
Click Add to stack up different color settings
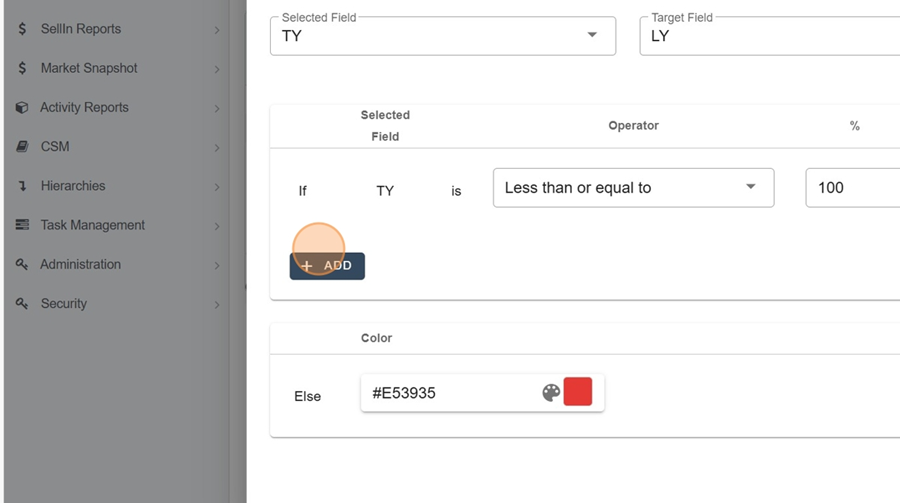
The bottom right cell (named else) shows the color if a value doesn't match any category
Save and view your Widget