Here, we'll look at different ways you can set up a periodic table widget
For more info about setting up Dashboards and various Widgets, check out this article:
Creating a dashboard and adding widgets
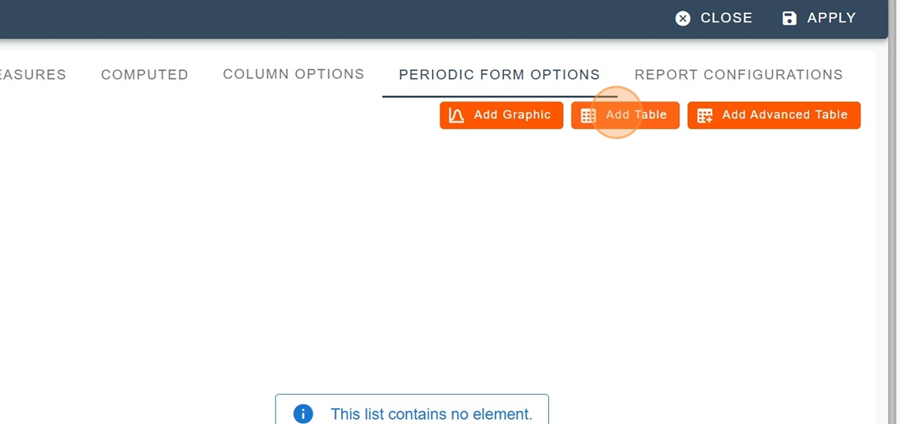
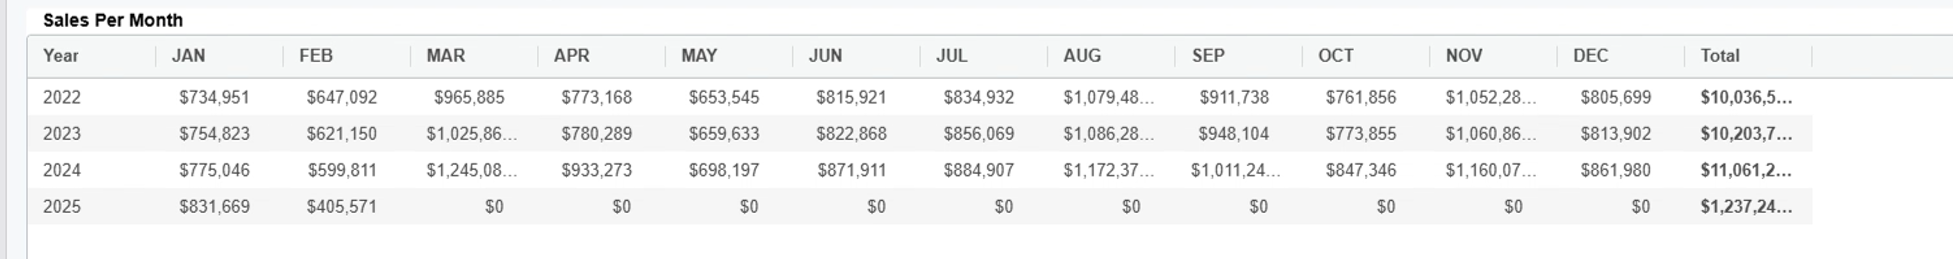
Before adding this type of widget, you need to have a periodic table already created. So first we'll see how to create a periodic table, and then how to show it as a widget in the Dashboard.
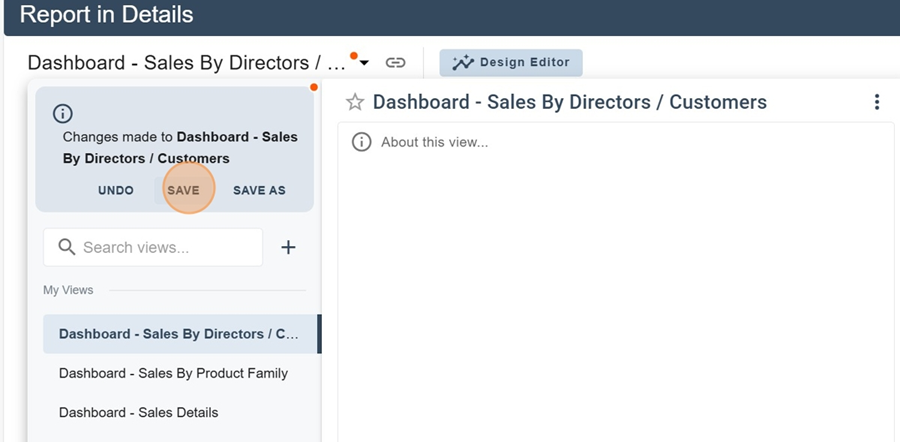
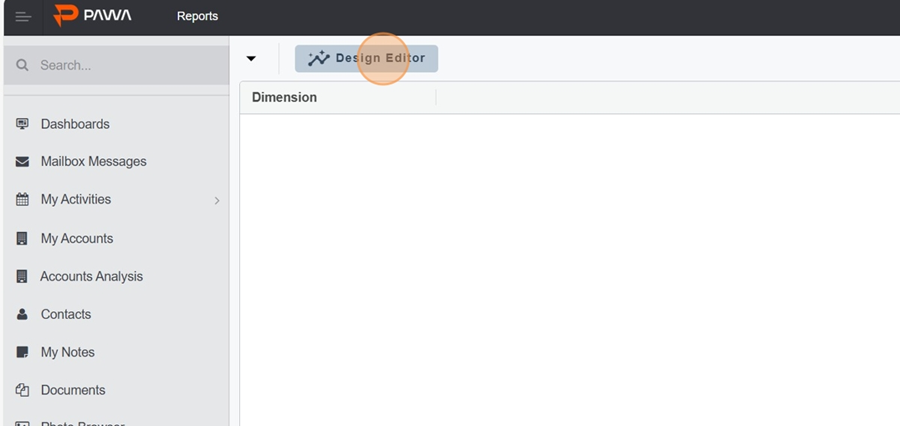
To create a periodic table, go to the Reports section and click on the design editor for your chosen report
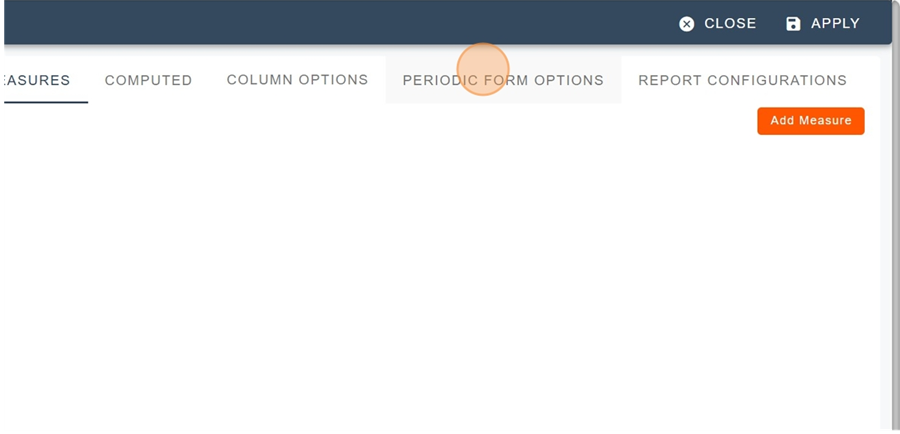
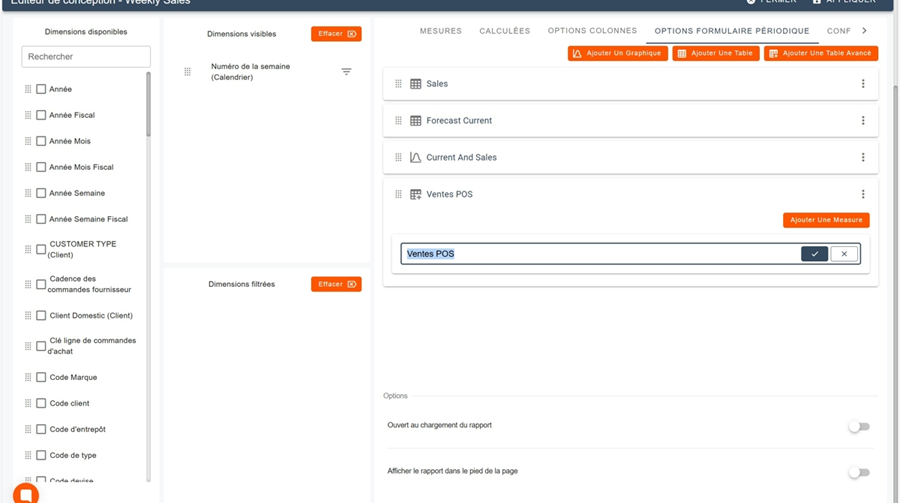
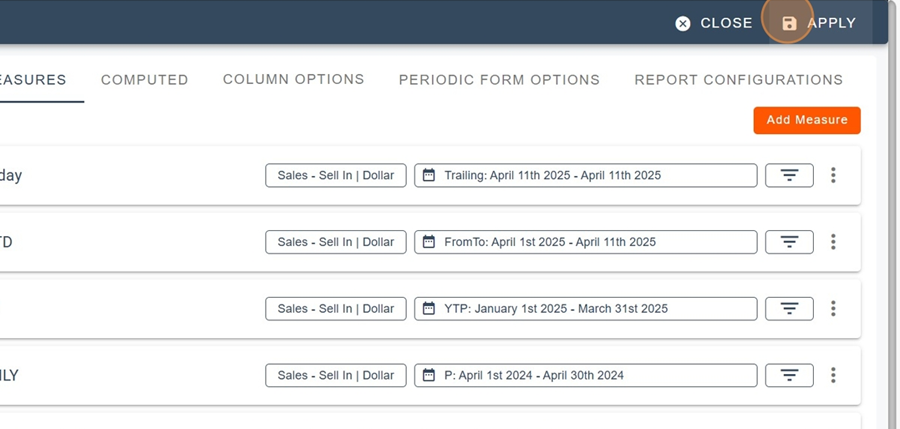
Head to the Periodic Forms Options section
Click on add Table
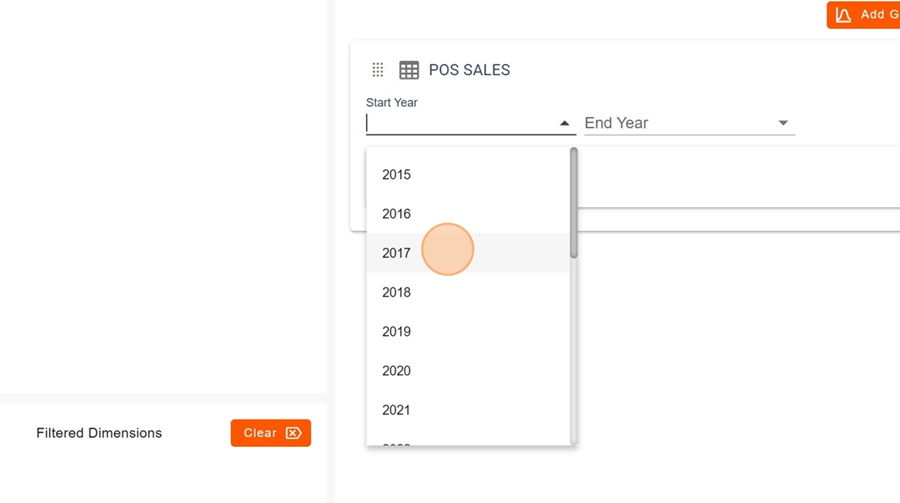
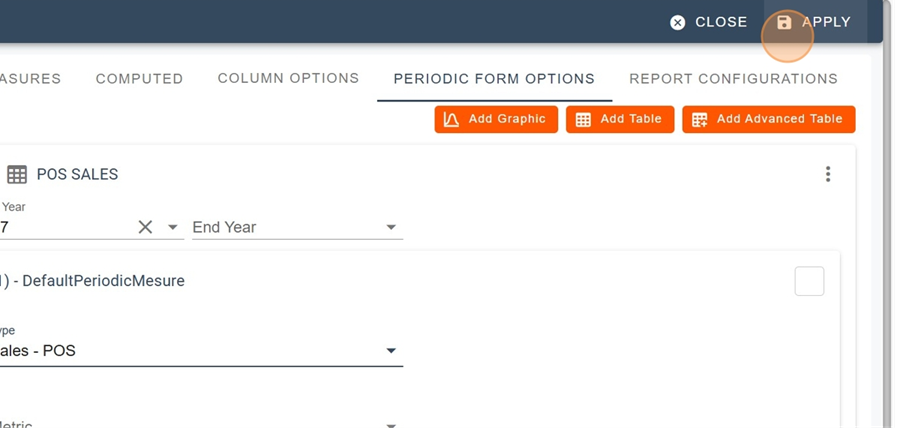
Choose your configuration options
Click on Apply
for more details about creating a recurring form, you can check this article:
How to Create a Metric Report
This page explains how to create a metric report and the different configuration options
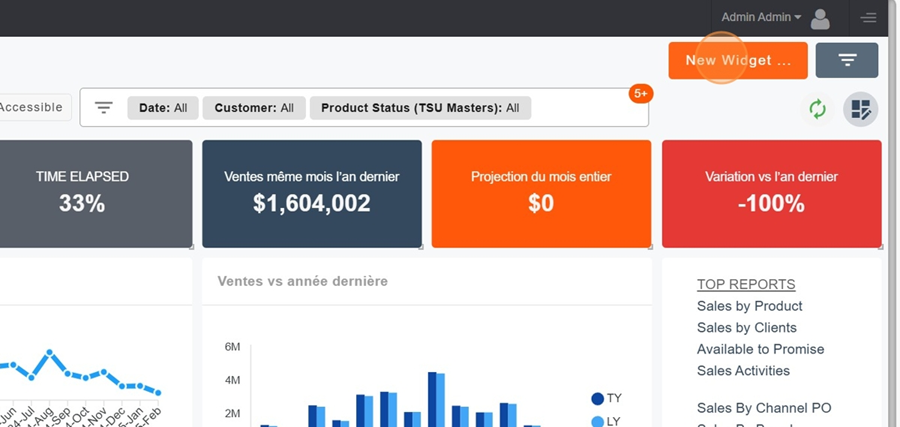
To add a widget, first click on the squares icon at the top right of the screen
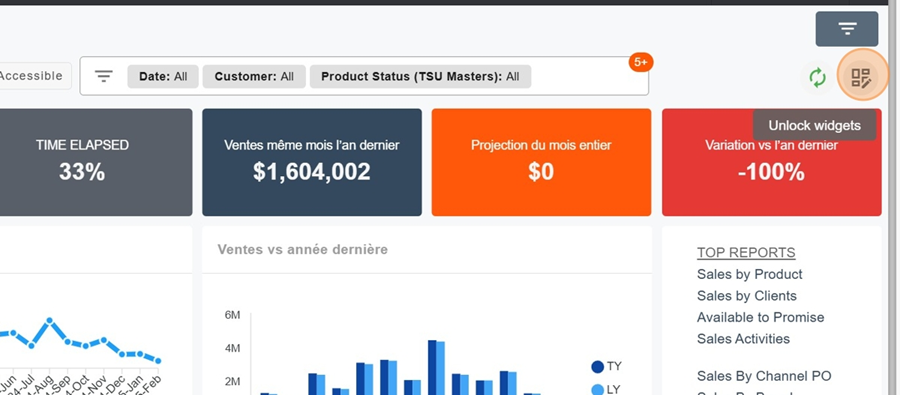
Then click on the orange box New Widget
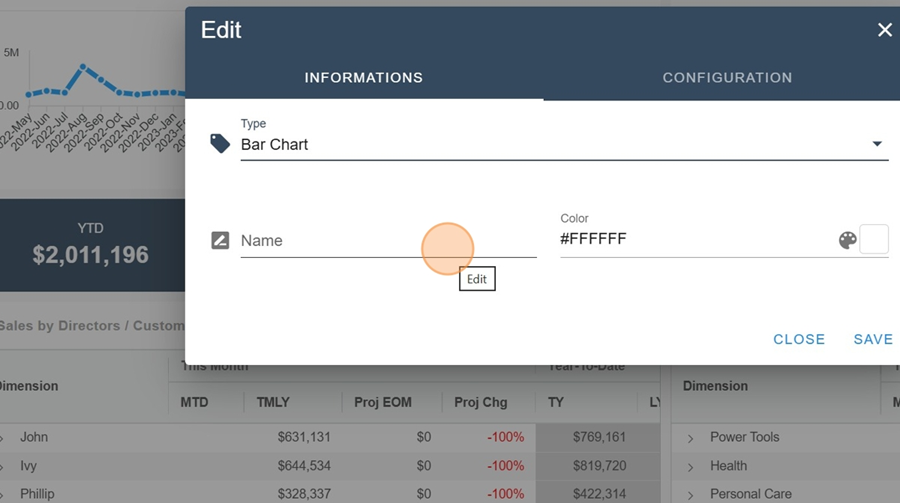
Name your Widget.
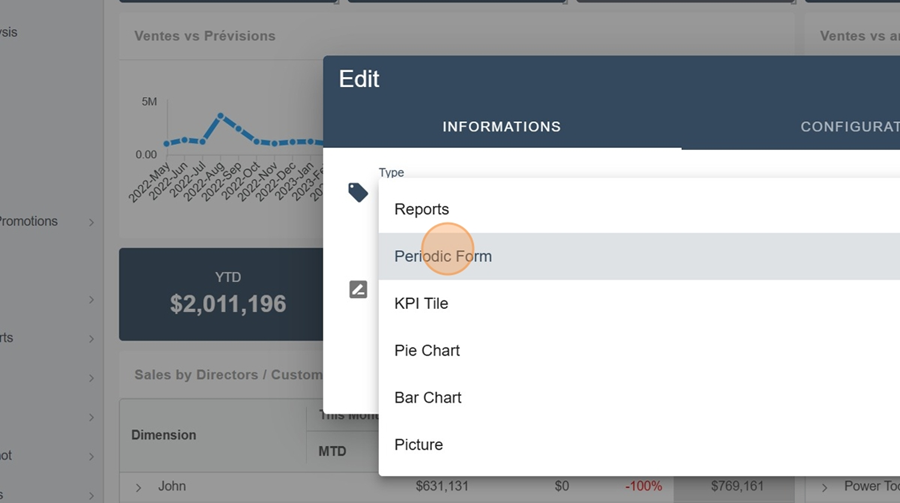
Choose the Periodic form option for the type, in the Informations section
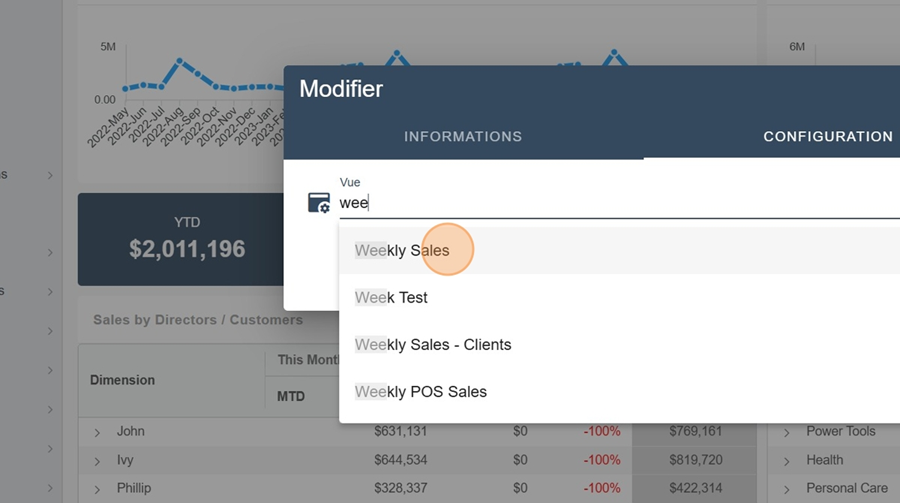
In the Configuration section, pick the report you're going to reference for the view and save
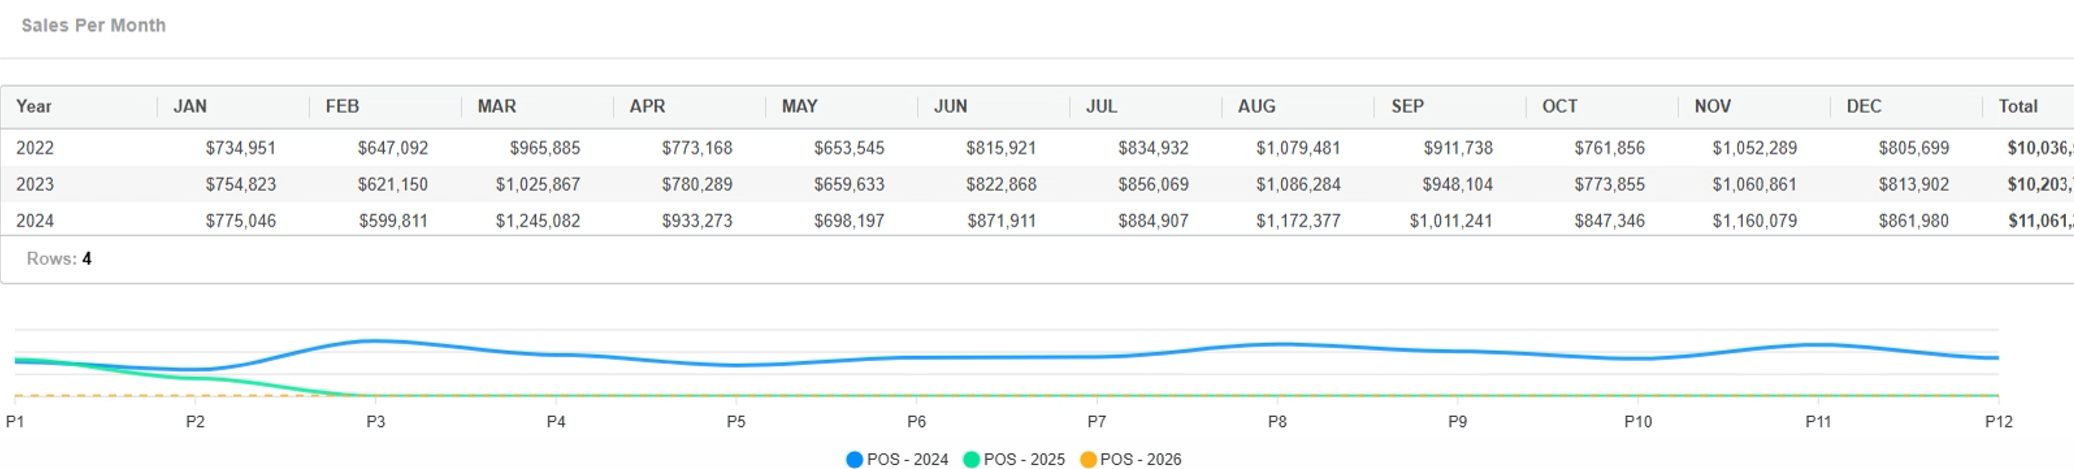
So you'll see your table show up at the bottom of the screen, like here for example
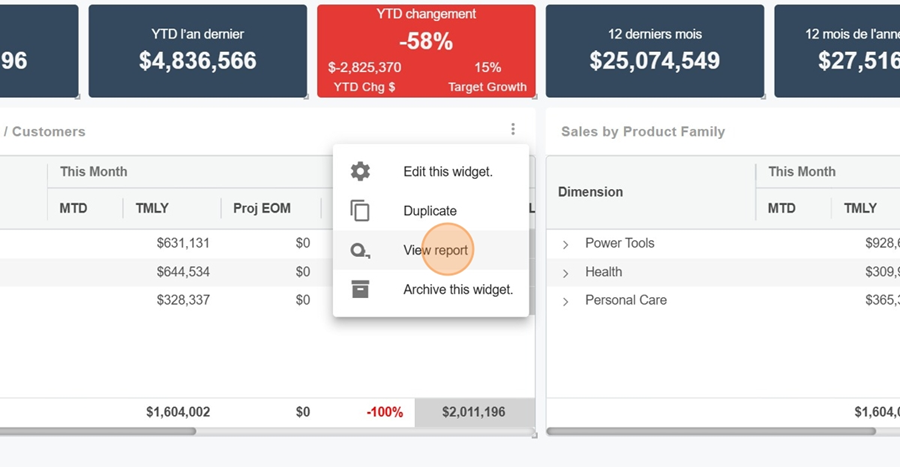
To edit or remove the report's title, click on the three dots in the corner and pick the View report option
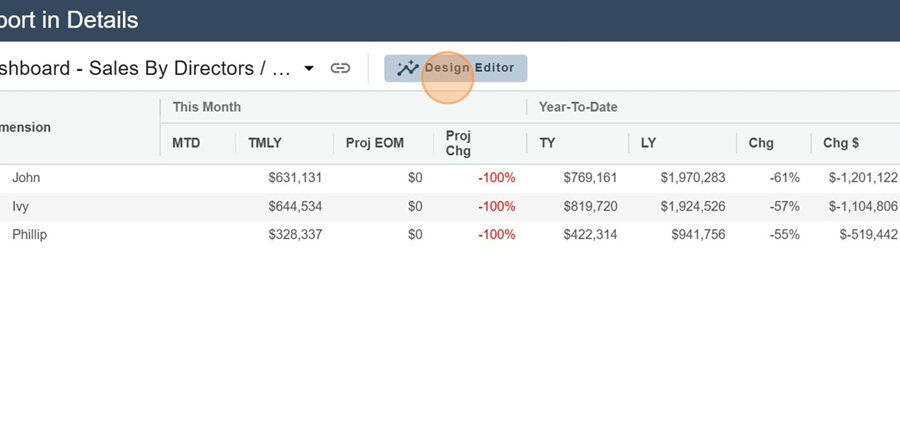
Then go into the design editor
You can then just remove the title, hit the space bar and save
Don’t forget to click Apply
Then click on the report title and save your changes