Here we'll look at different ways to set up a widget that shows a bar chart.
For more info about setting up your Dashboard and different Widgets, check out this article:
Creating a dashboard and adding widgets
This article gives an example of creating a weekly metric report related to the article explaining how dashboards and different widgets work in Pawa
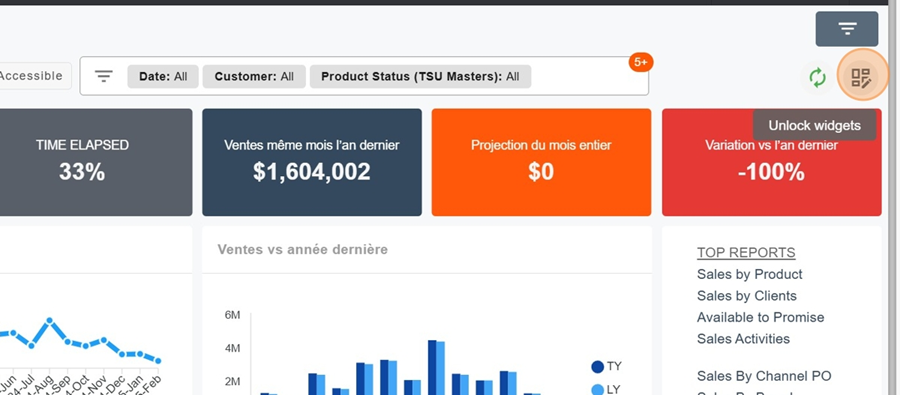
To add a widget, first click on the squares icon at the top right of the screen
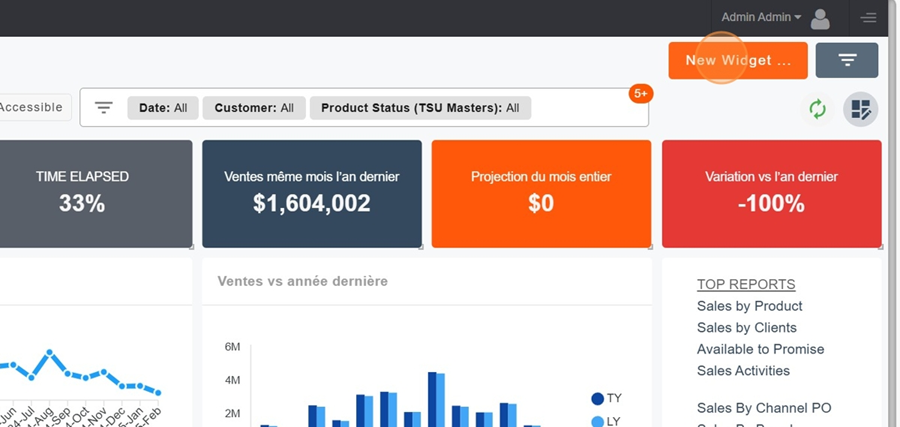
Then click on the orange box New Widget
Name your Widget.
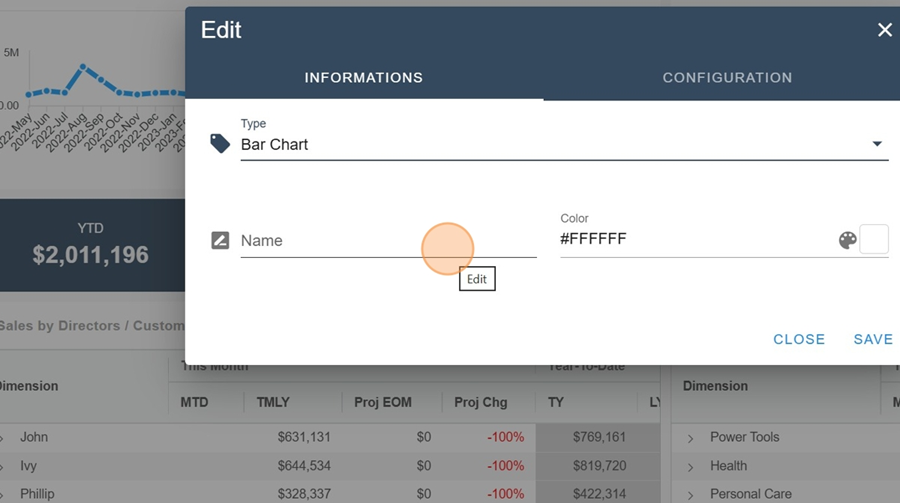
Next, select the type of Widget
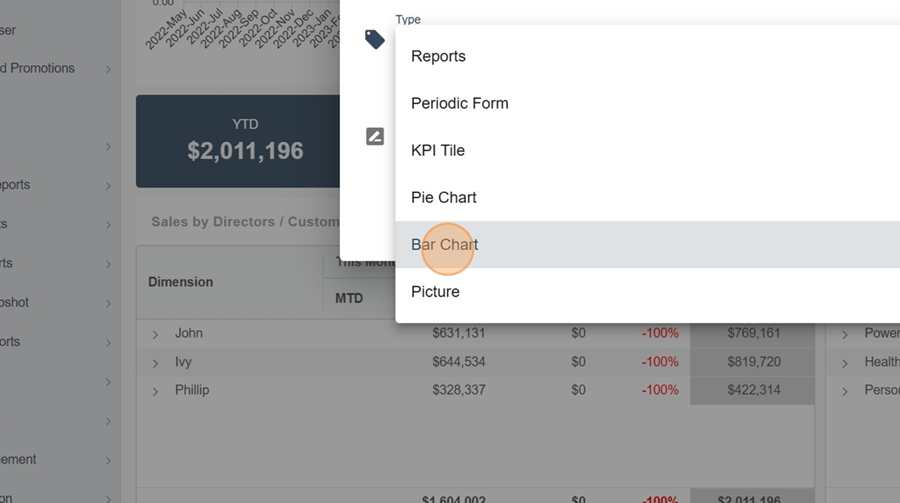
Let's see how to set up a grouped bar chart here.
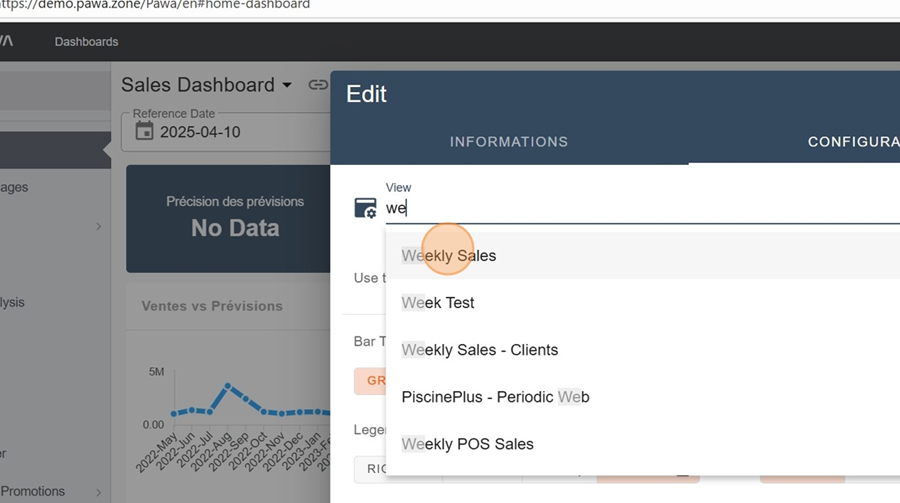
Once you pick the Bar Chart Title under the Type section, go to the Configuration
Type the name of the report you want to use in the search bar (for example here; Weekly Sales
Then select your measures
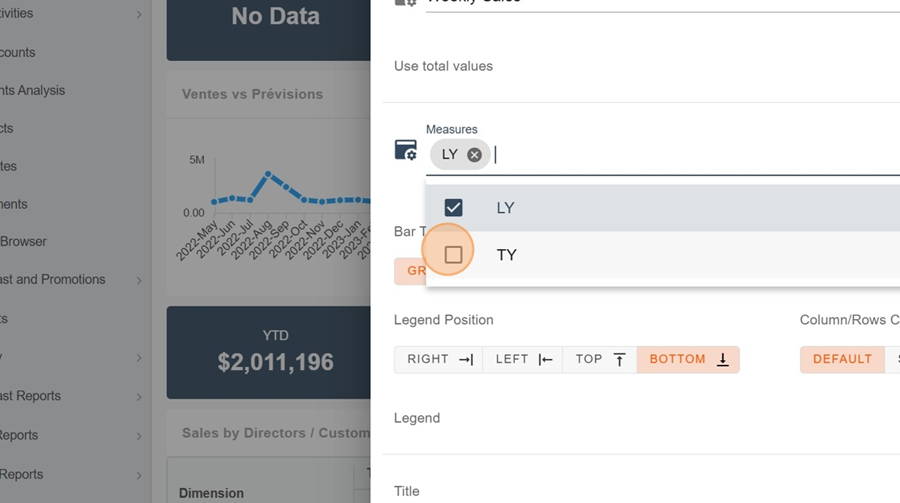
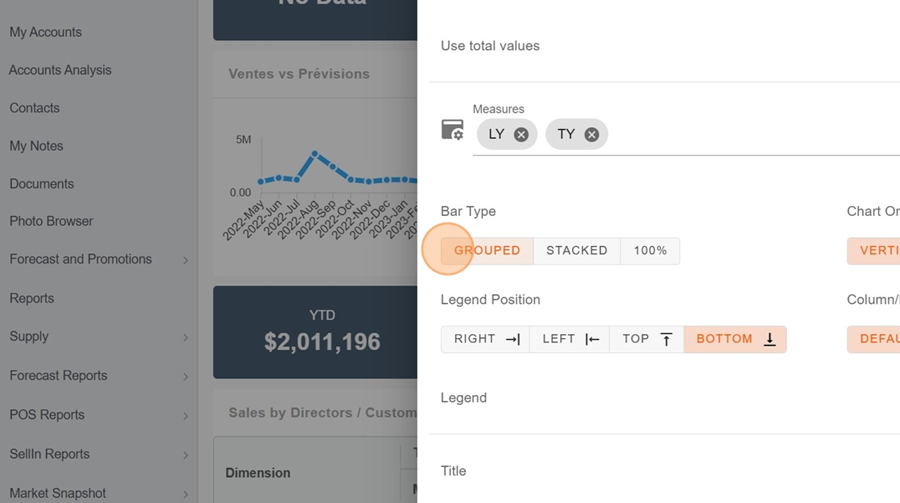
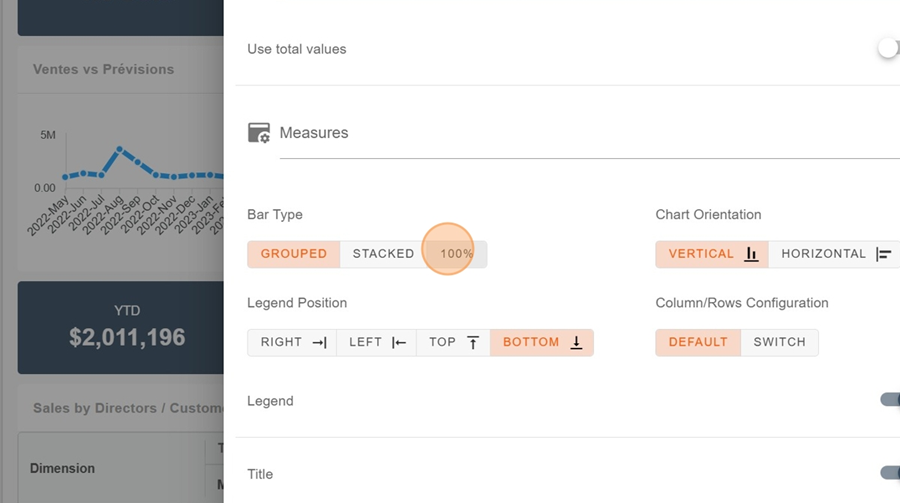
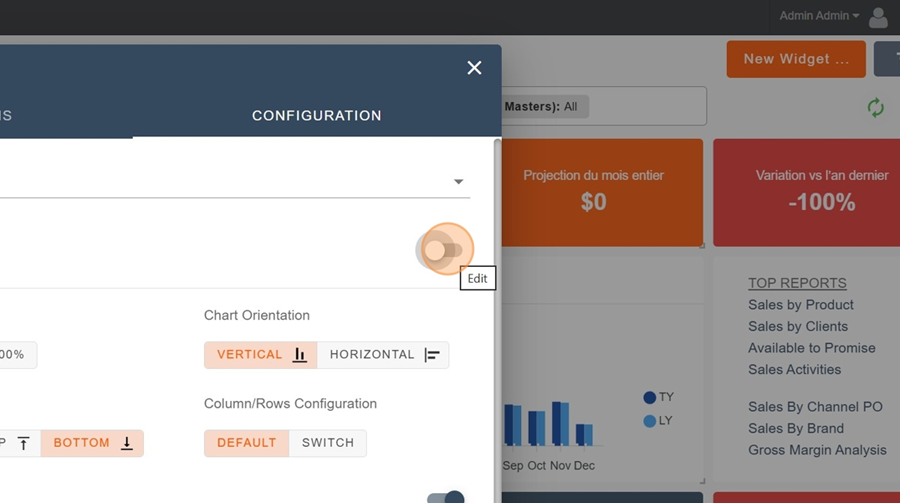
Pick your preferred options like bar type, dimension, legend position, and column/row setup. For bar type, we'll pick Grouped for this example.
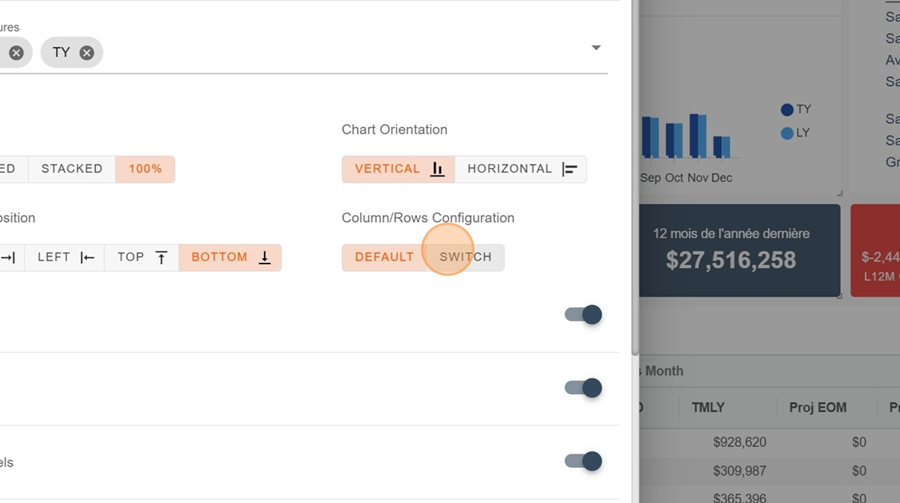
Here, let’s say we want to check out the weeks on the horizontal axis, and the $ on the vertical axis, you’ll need to pick the Switch option, since the default report setup was the opposite.
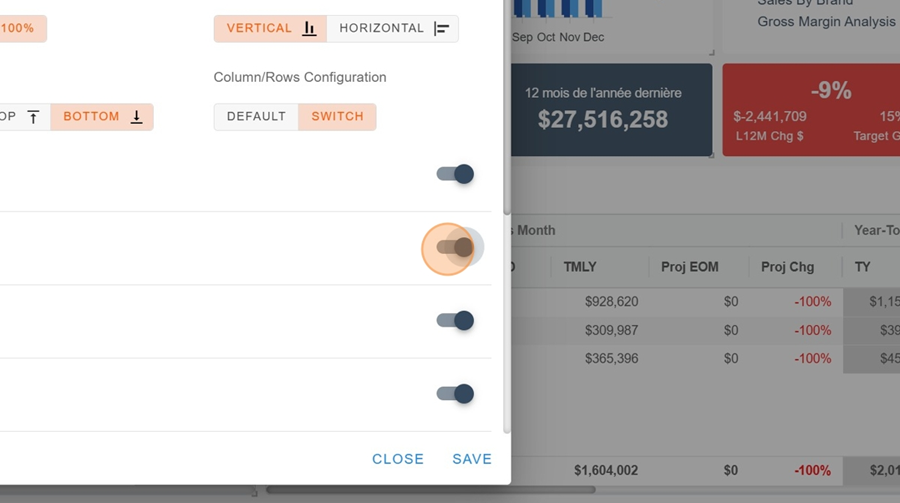
Then check the options you want (or don’t want) to see, and click save
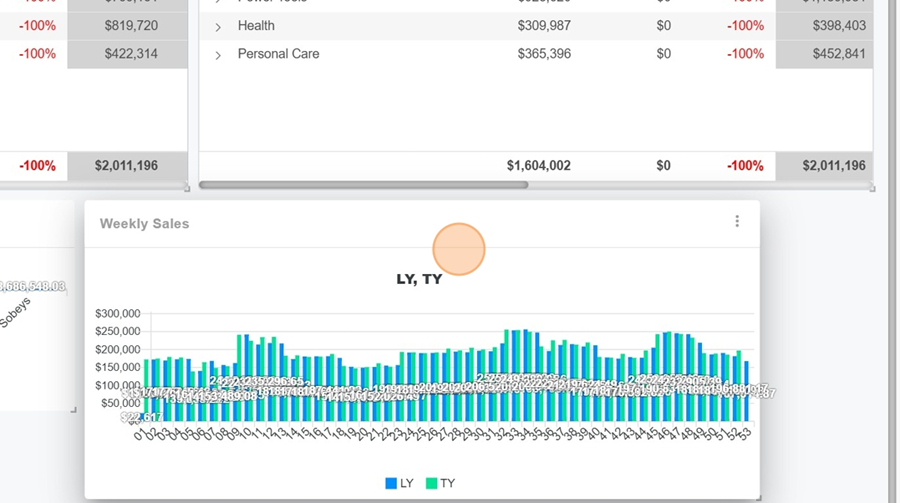
Now you can check out your table and tweak some of the display if you need to
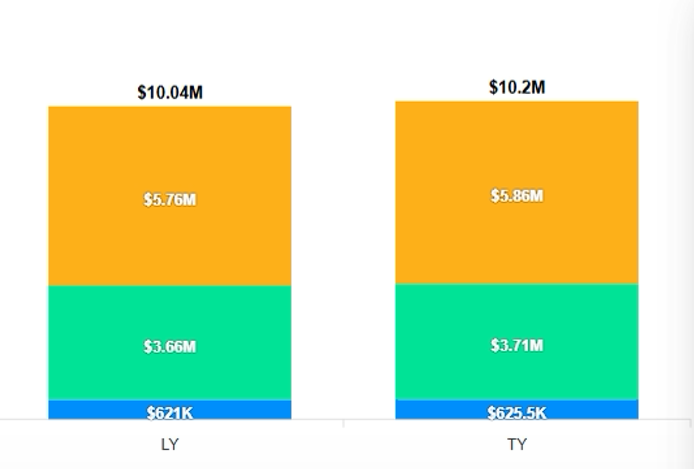
By repeating all the same steps as in the section above, but this time picking the Weekly Sales-By Customers view and theStacked option for bar type, we end up with a totally different chart
This time we can see, for each customer, what’s shown for last year versus this year
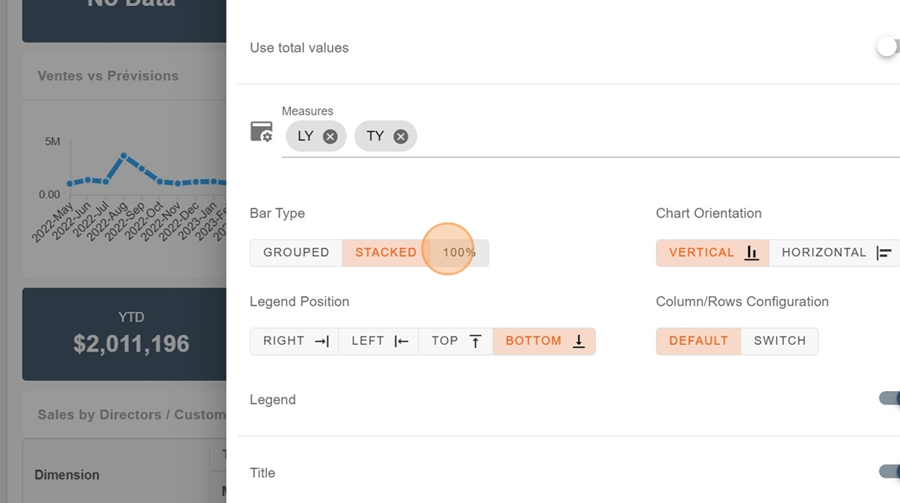
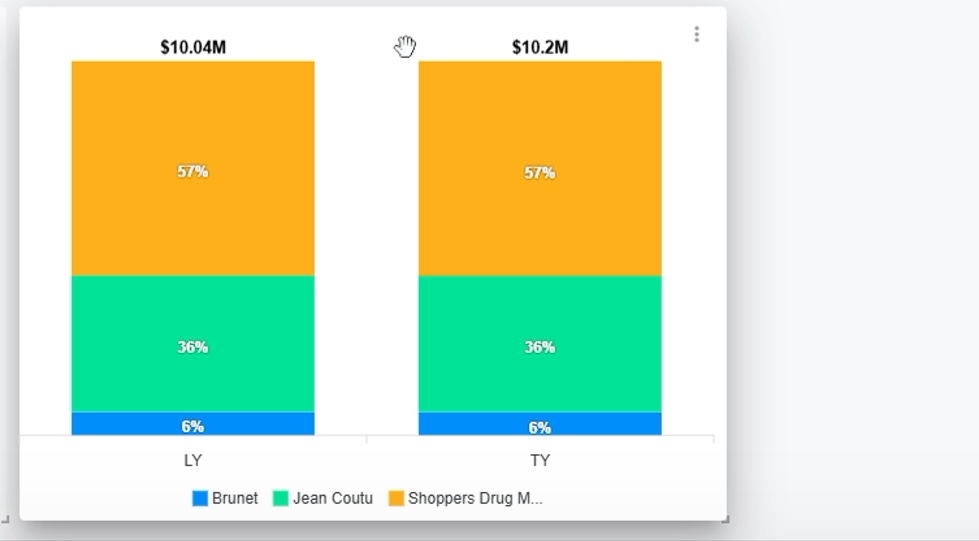
Still in the bar type selection, you can choose the 100% option, which lets you compare this time in percentages
Like this. You can see that both clients took exactly the same proportion during the change.
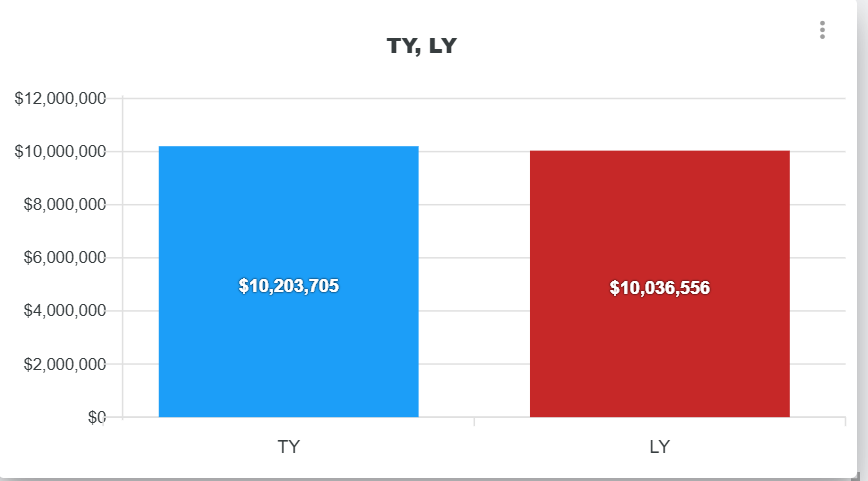
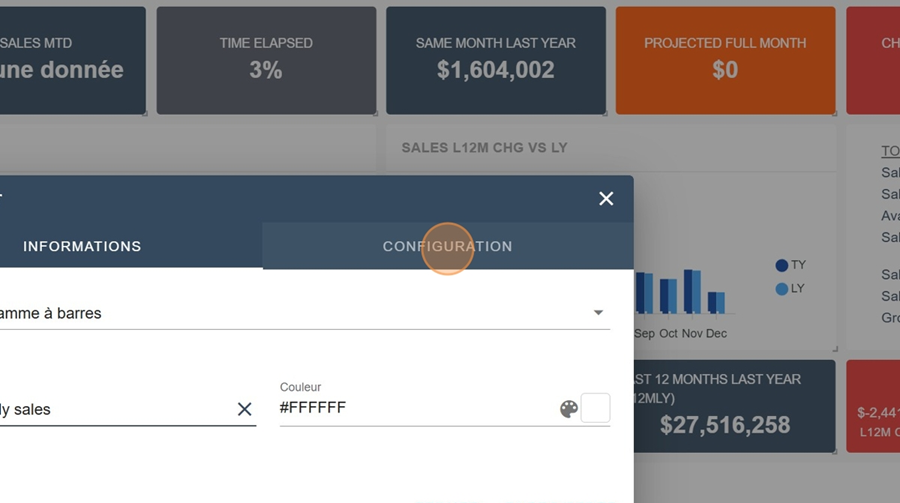
By checking the use total value option in the bar chart configs, only the totals for this year and last year will be shown.
You can choose the colors however you like
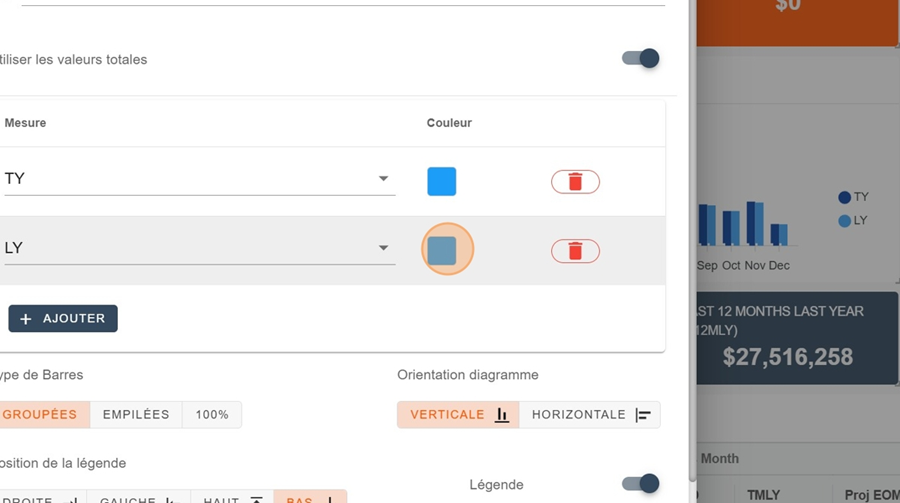
Like this