Creating a report is required before you can browse a dashboard and add widgets to it. So, let’s walk through an example here by creating a weekly report.
For more info about creating a report, you can also check out this article:
Creating a metric report
This page explains how to make a metric report and the different configuration options
Pawa users often ask how they can create a report by week.
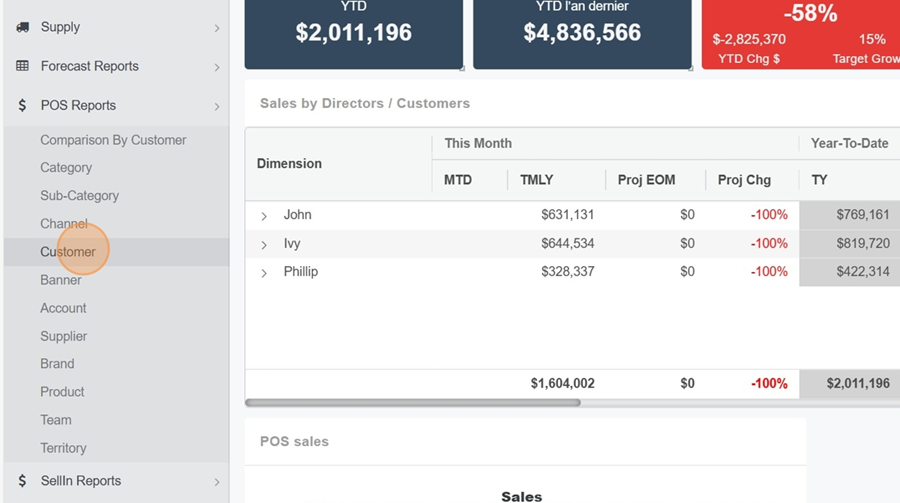
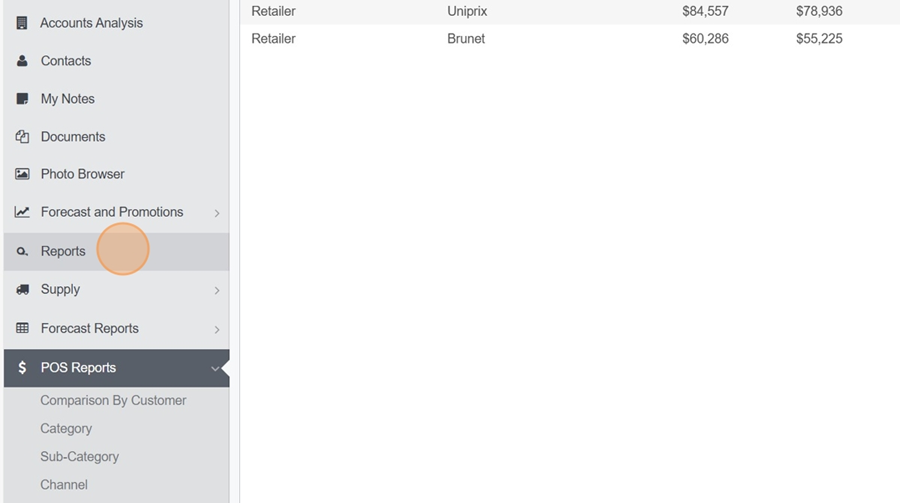
One way to check out weekly reports is to go to POS Reports and pick the sub-category you want to view.
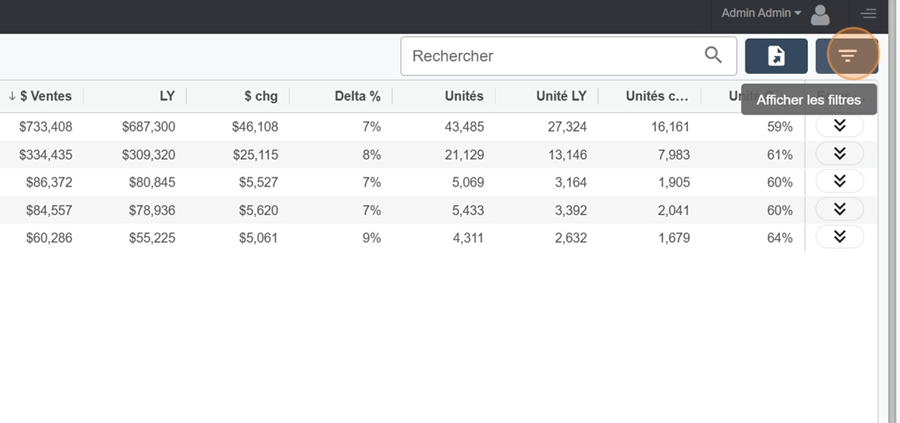
Click on the filter icon at the top right to show more navigation options
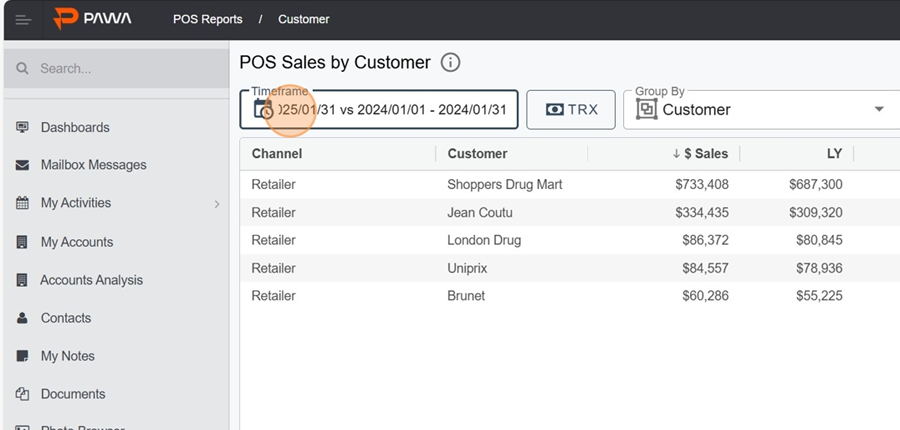
When you click on the calendar section, you can pick which weeks you want to view for your reports
For example here, by selecting previous week, 1 week and clicking apply
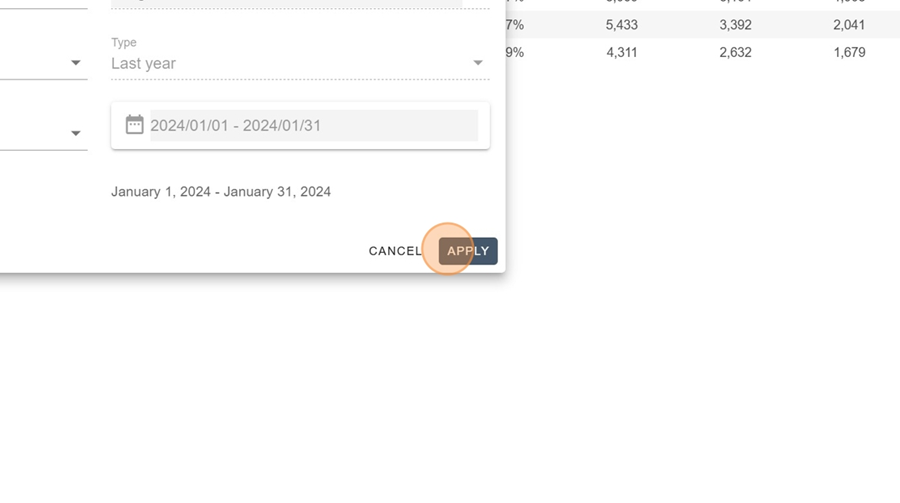
We can view the week we want
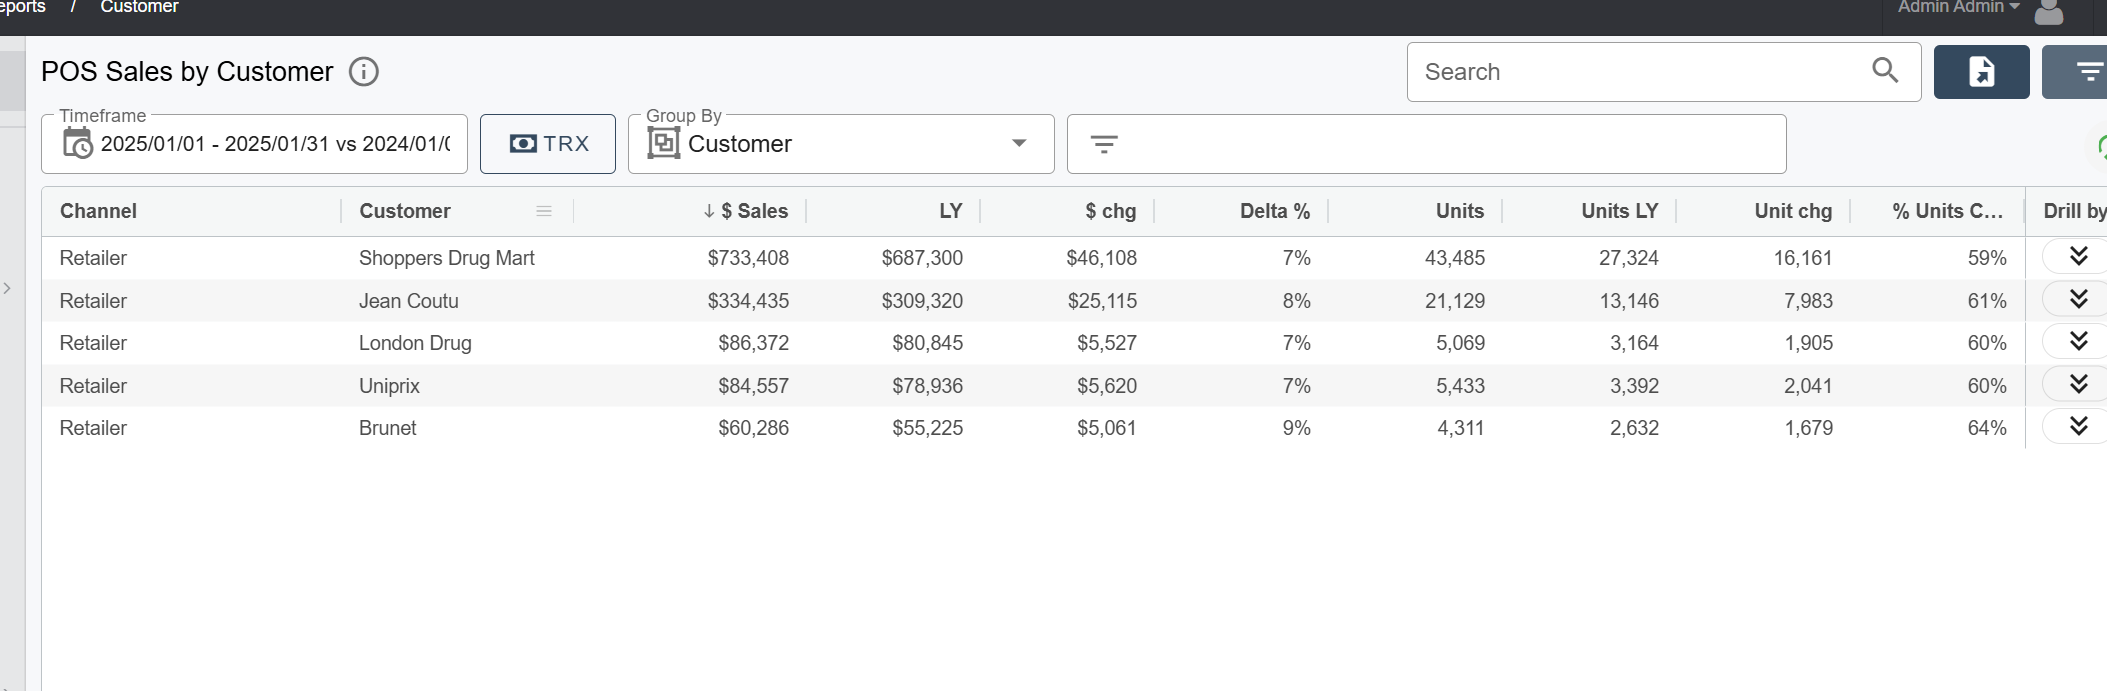
However, this process can get long and not super efficient if we want to compare weekly reports by viewing them at the same time.
So, the Dashboard option is super useful if you want to make charts, for example, to compare different data.
We're going to create 2 reports here that'll be our example for later making widgets in the Dashboard section.
First, go to the Reports section
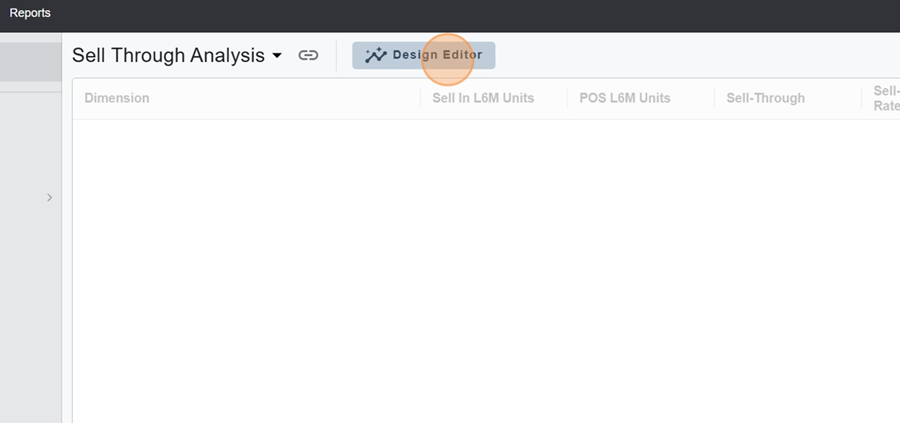
Click on the design editor to create your report
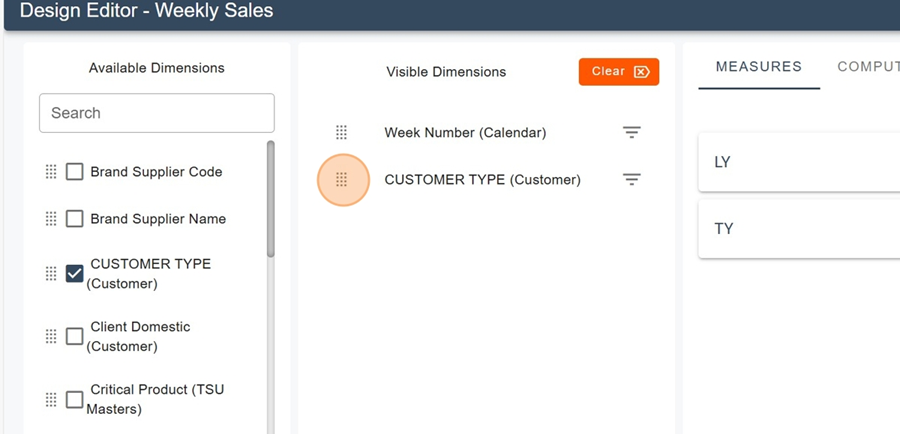
Here, we’ve added the number of weeks and clients in the visible dimensions
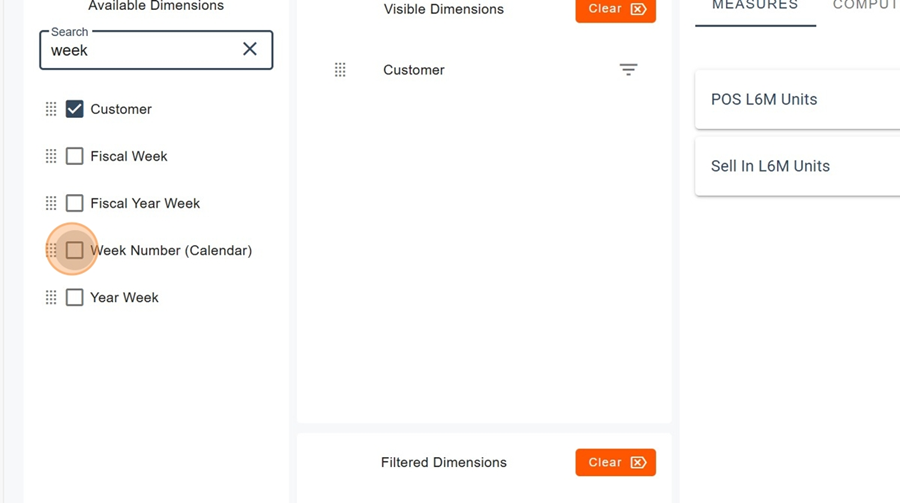
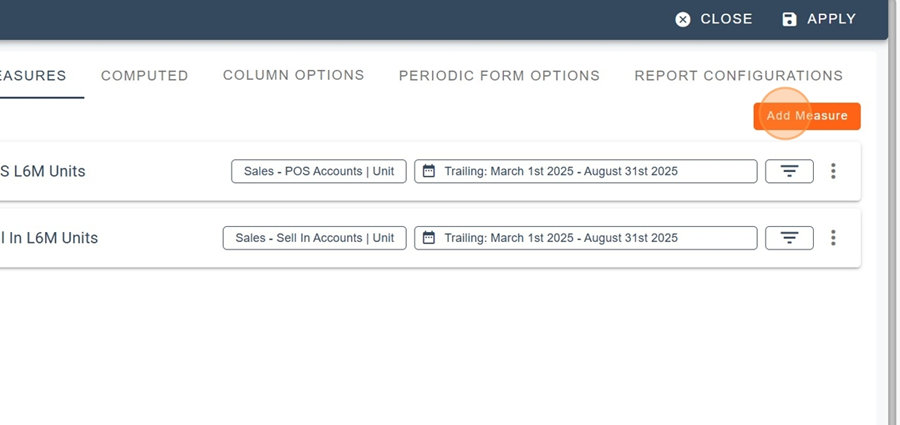
After that, you can add the measures by clicking on Add a measure, and filling out the settings
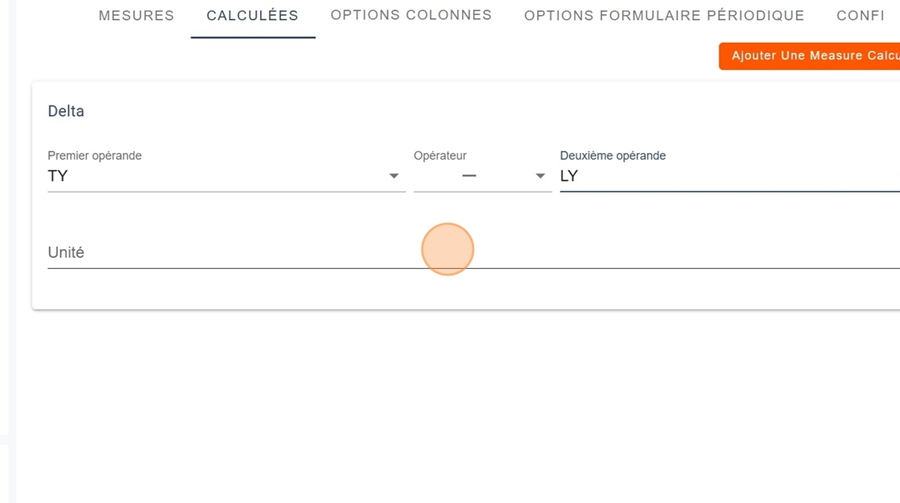
In the calculated section, we then add the Delta measure and complete the settings like this to compare last year to this year
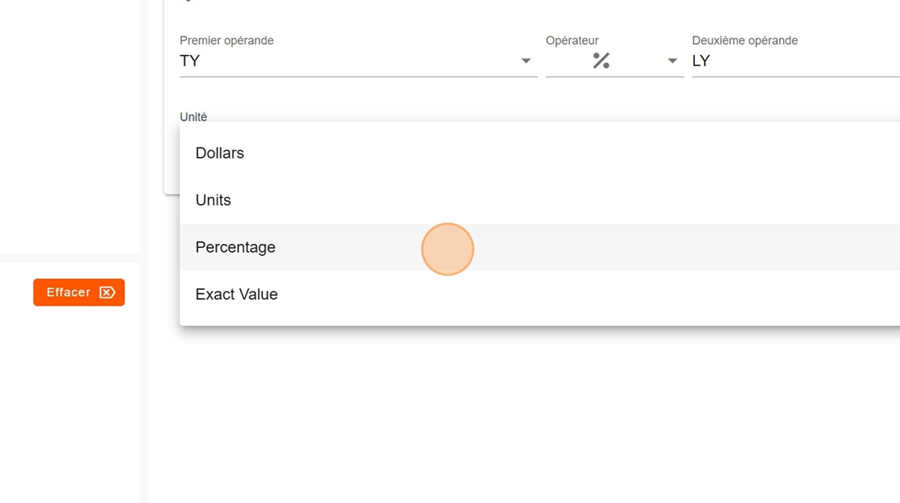
Adding a percentages section can also be useful, just by picking these settings
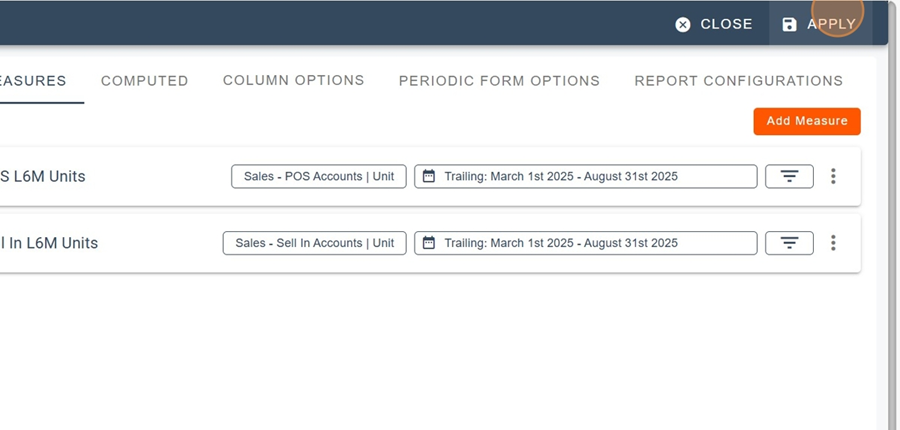
Click on Apply, top right, to create the report
Next, make a second report. In this example, we'll put the customer category first in the visible dimensions and hit apply
Click the title and then Save As to rename the report
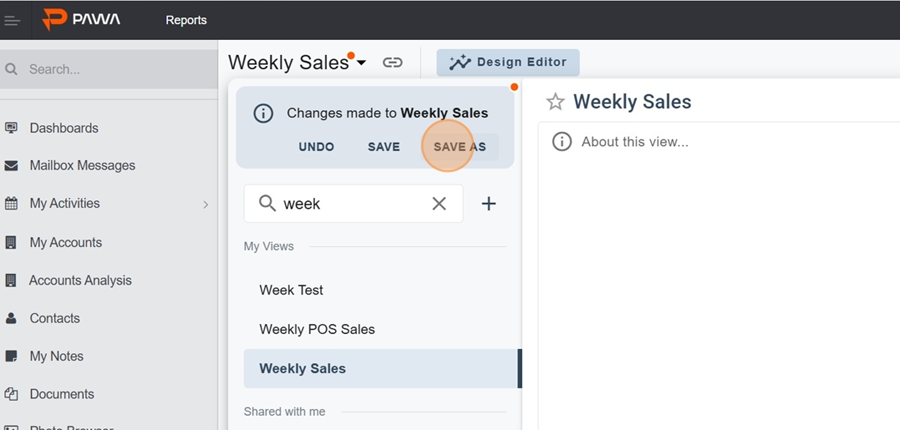
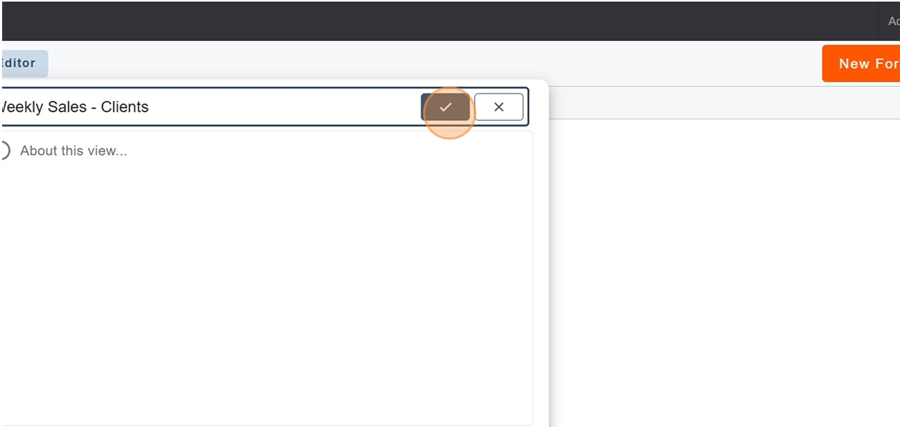
Rename your report and save it
Once the reports are created, we'll be able to make a bunch of cool widgets and easily compare weekly reports, just like the example above. See the article
Creating a dashboard and adding widgets
This article explains how a dashboard works and the different widget options