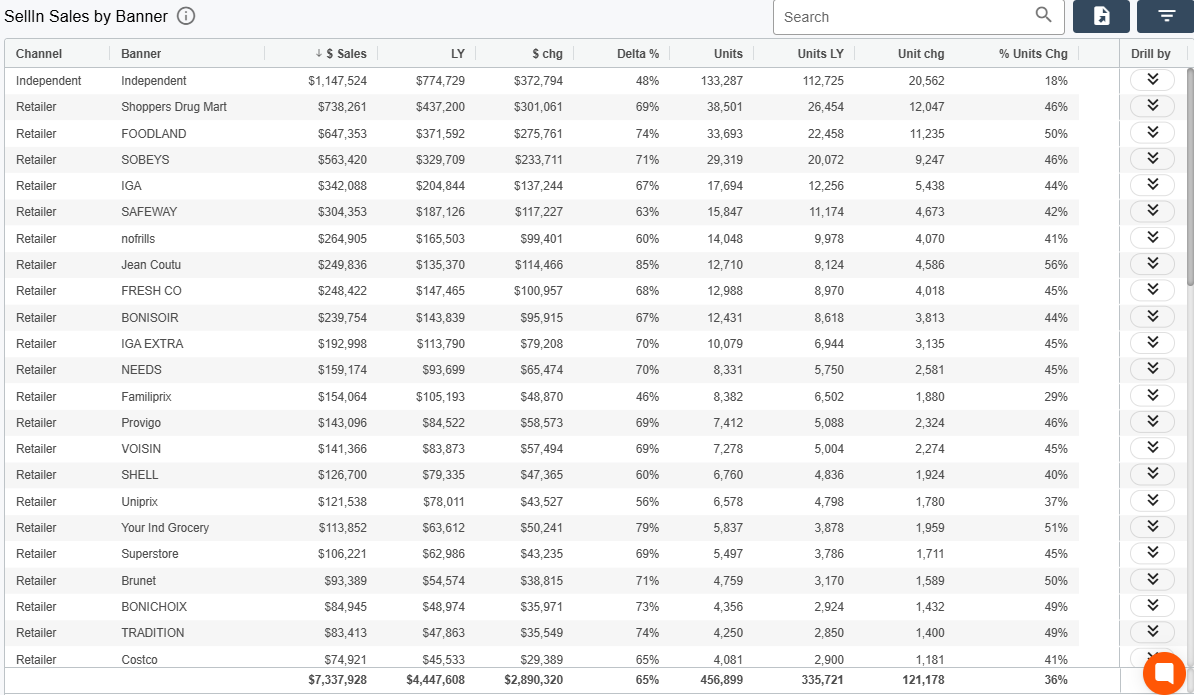
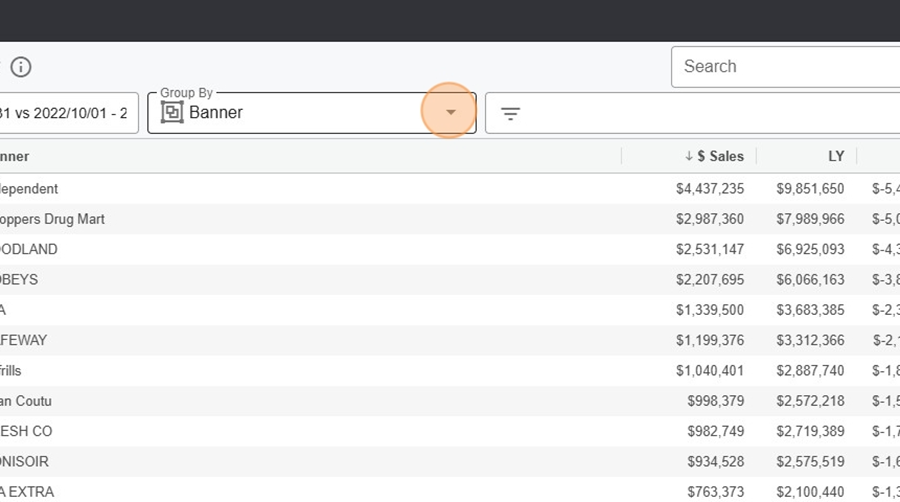
The example report shown above is a sales report by banner, containing the following data:
Channel (Channel) : The type of sale (Retail).
Sub Channel (Sub-channel) : The sub-category of the channel (e.g., Drug Store, Grocery).
Banner (Banner) : The specific brands or banners (e.g., Jean-Coutu, Walmart).
$ Sales ($ Sales) : The total sales in dollars for the specified period.
LY (Last Year) : The sales for the same period last year.
$ Chg ($ Change) : The difference in sales between this year and last year.
Delta % (Percentage Change) : The percentage change in sales compared to last year.
Units (Units) : The number of units sold.
Units LY (Units Last Year) : The number of units sold last year for the same period.
Unit Chg (Unit Change) : The difference in units between this year and last year.
% Units Chg (Percentage Change in Units) : The percentage change in units sold compared to last year.
“Drill by” (Data Drill): feature described here
Pawa supports several types of reports, enabling a comprehensive analysis of business performance. Whether it’s for POS sales reports, which track actual in-store transactions and help understand purchasing behaviors, or Sell-In reports, which focus on supplier-to-retailer sales.
This report provides information on point-of-sale (POS) data, showing sales performance based on various criteria such as banner, channel, sub-channel, and product category. It tracks actual sales transactions, offering valuable insights into how products perform in different retail environments. It helps analyze real-time sales data, identify trends, and understand customer purchasing behaviors.
The Sell-In sales report tracks sales made from suppliers to retailers or distributors, focusing on the entry of products into the retail supply chain. It provides information on the quantity of products purchased by the retailer, but not necessarily sold to the end consumer. This report is essential for managing stock levels, forecasting demand, and evaluating supplier relationships.
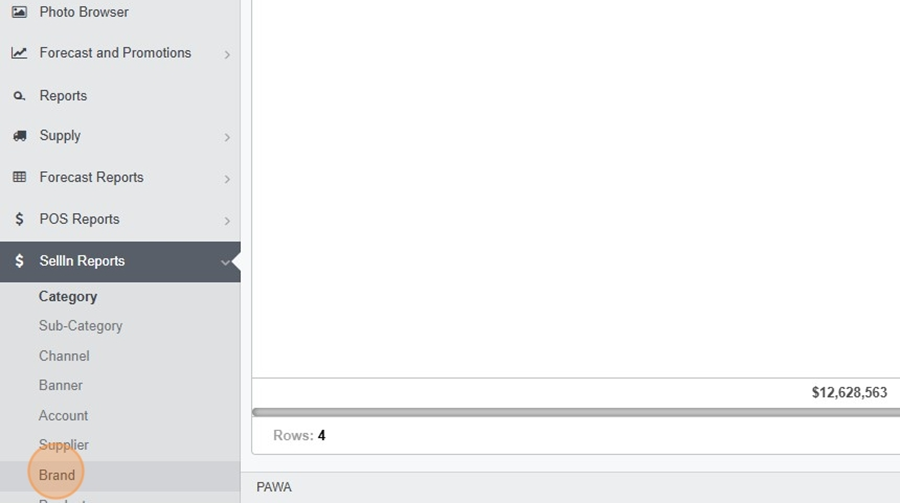
It is possible to select, via the menu, the type of report you wish to display. You can choose between:
POS Reports (reports on points of sale)
Sell-In Report (report on incoming sales)
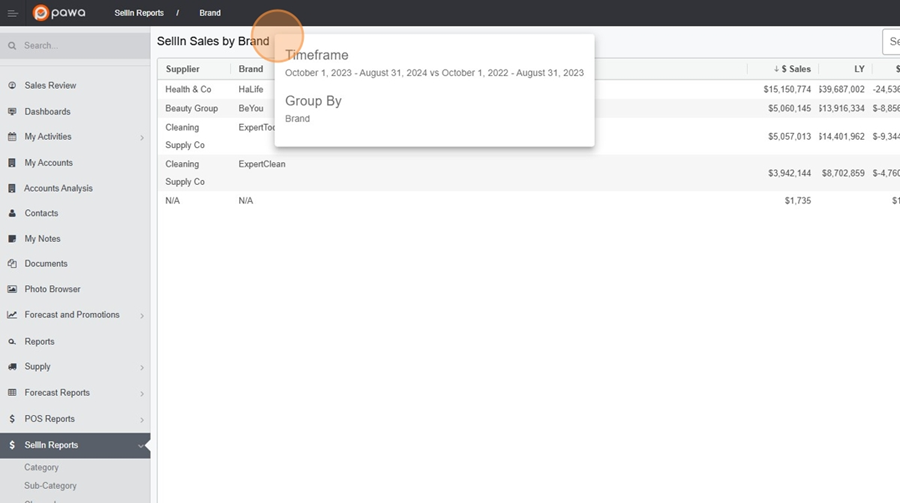
By selecting the desired type of report, you can also choose at what level to start the analysis. For example, if you want to see sales by brand in the Sell-In report:
Navigate in Sell-In Reports > Brands
To view the Time Range, click on the icon i to the right of the title.
To modify the Time Range, refer to the Filter Display
Navigate in Sell-in> View the Time Range
Click on the icon i
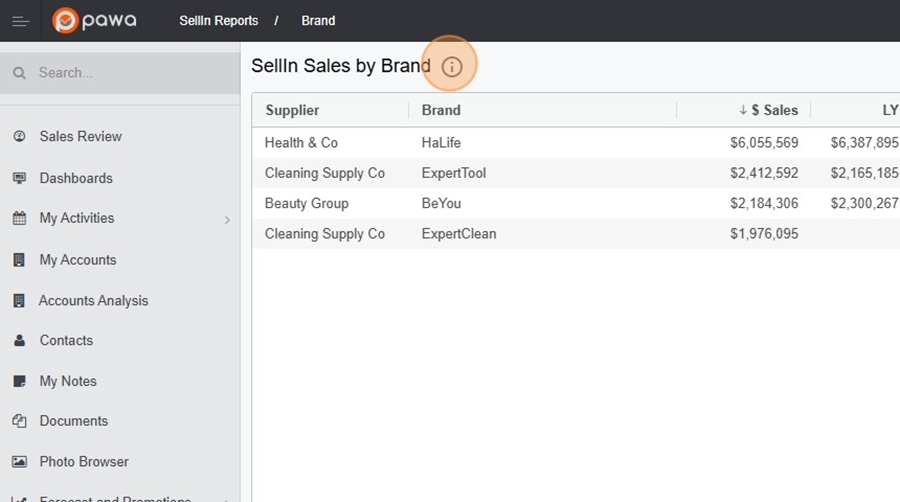
View the time range

The search bar allows you to isolate certain elements.
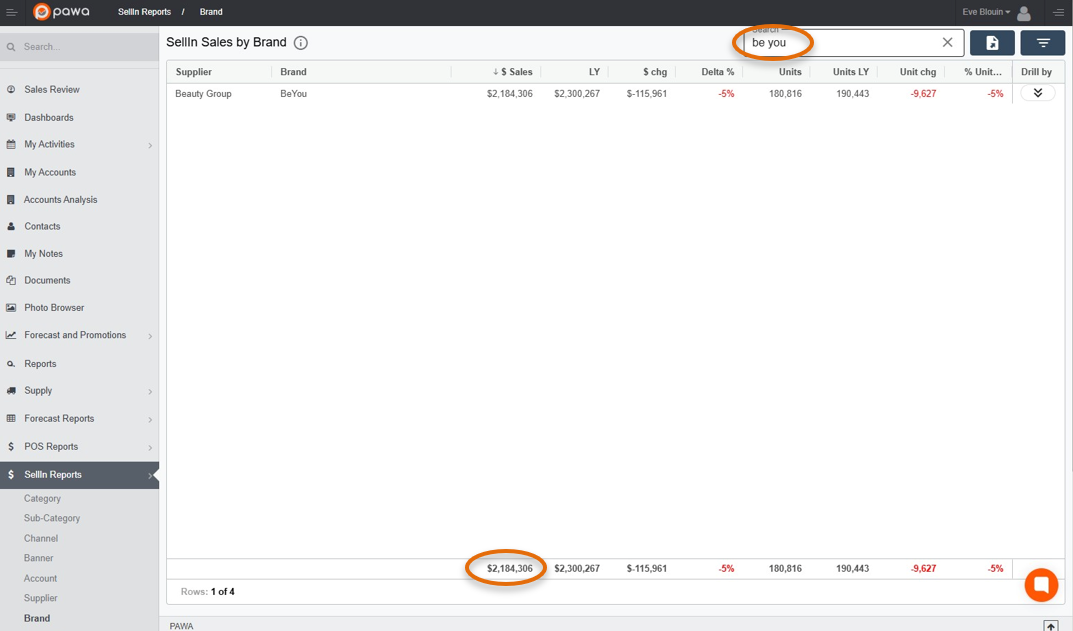
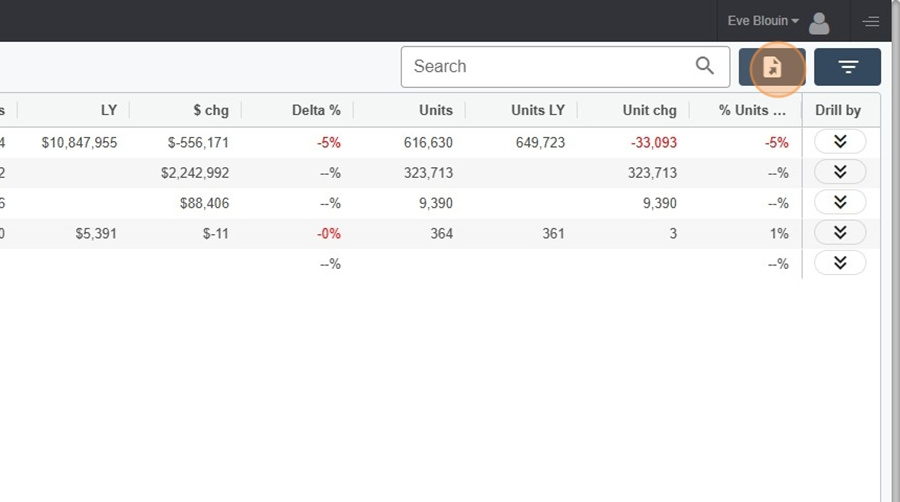
It is possible to export the results to an Excel file. Simply click on the floppy disk icon to the right of the search bar.
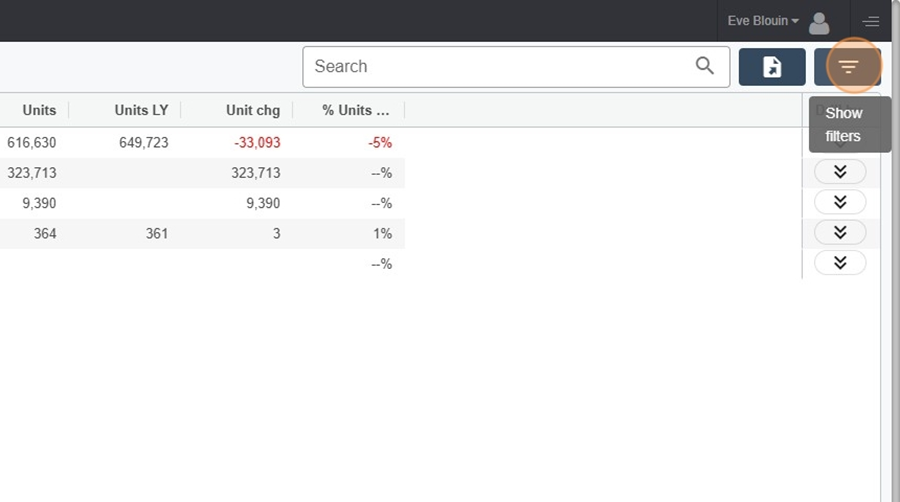
The filter display option at the top right of the page allows you to filter your searches and make certain modifications. This option allows you to, among other things:
modify the Time Range
change the granularity of the information viewed and
apply multiple filters at once, with the option Grouped by
Navigate in Sell-in> Modify the Time Range
Click on the filter display icon, at the top right
Click on the time range to open the menu

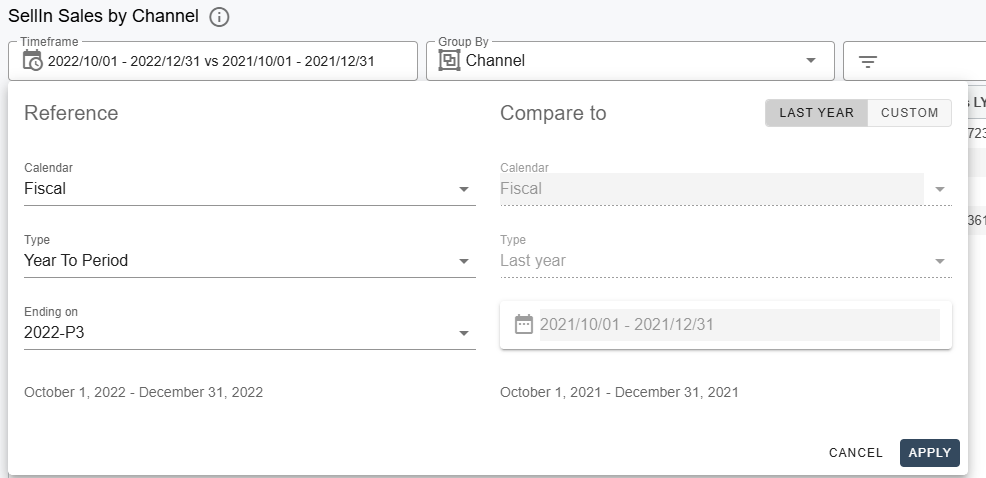
It is possible to configure different types of calendars (fiscal, Gregorian, etc.)
It is possible to define different types of time ranges (year-to-date, previous weeks, etc.)
By clicking on the apply icon, your changes will automatically be applied to the current year and the previous year.
The option Period to date is the most used. It allows viewing the last complete period.
The option By period allows isolating a single period (for example P8, P10, etc.)
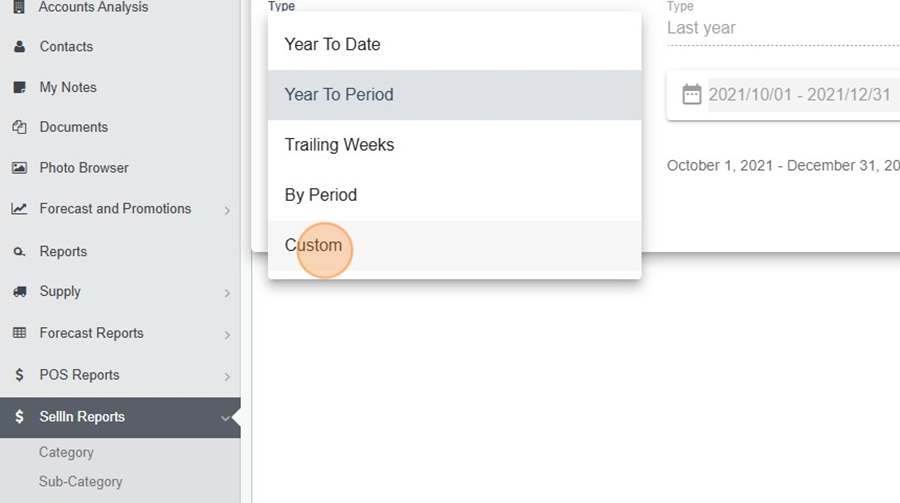
The option Custom allows selecting specific periods based on distinct dates (e.g., the Easter period)
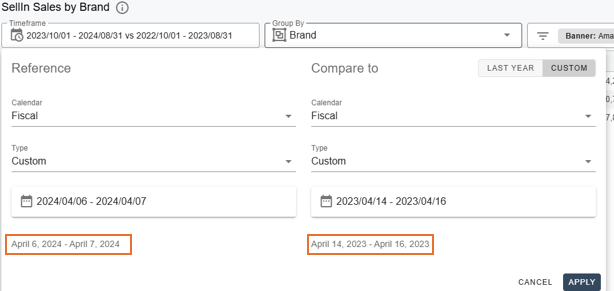
Navigate in the menu >Custom time range
Suppose you want to compare sales during the Easter period this year versus last year. It is possible, with the Custom option, to select the dates directly in the calendar.
Click on the Custom
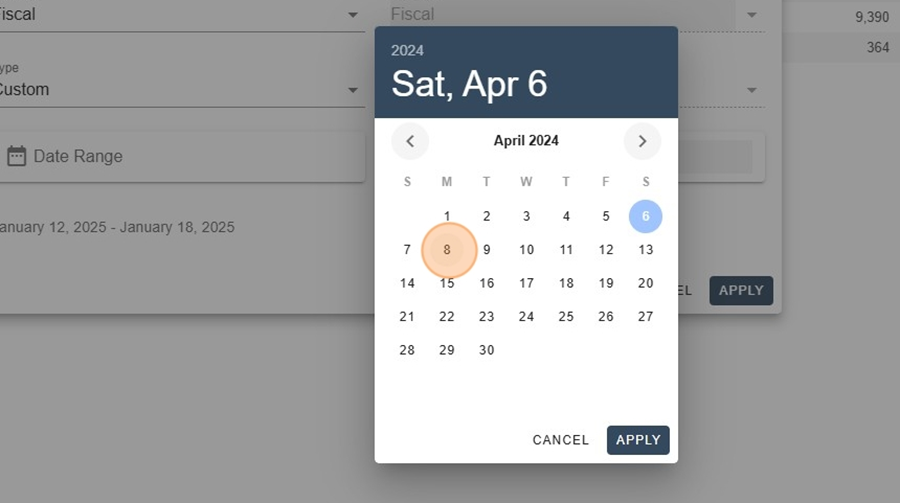
Click on the dates listed on the calendar

Select the desired dates and click apply
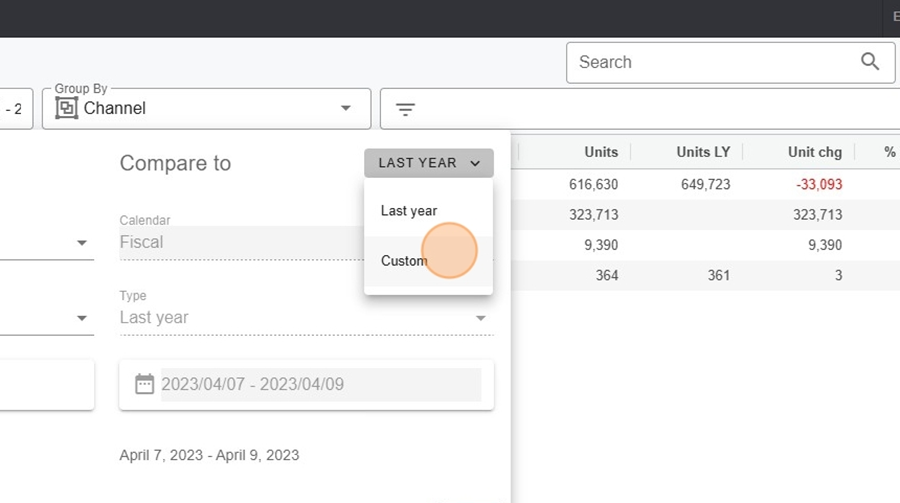
Select the custom option for the previous year, at the top right of the menu
Click on the dates listed on the calendar
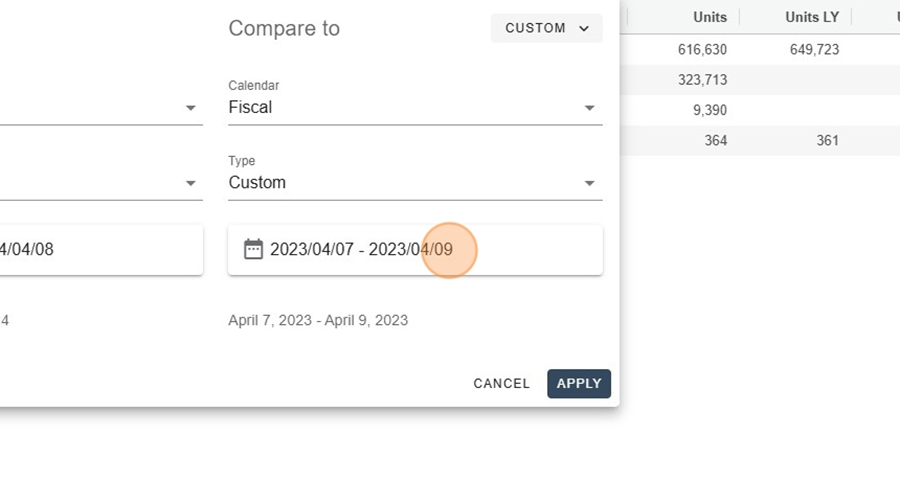
Select the desired dates and click apply

This will allow you to compare data from two distinct date periods.
The option Grouped by allows you to change the granularity of the information viewed and apply multiple filters at the same time.
Navigate in Sell-in > Grouped by
click on the dropdown menu Grouped by
select the desired option in the dropdown menu

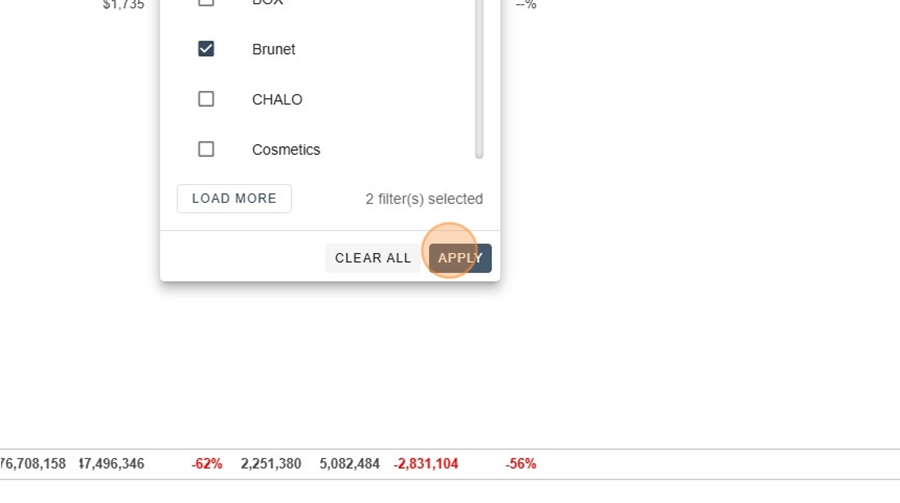
It is possible to apply multiple filters at the same time using the multiple filters option located to the right of the Grouped by
Navigate in Sell-in > Grouped by, multiple filters
Click here
Select your filters from the dropdown menu and click on Apply
Select the desired item
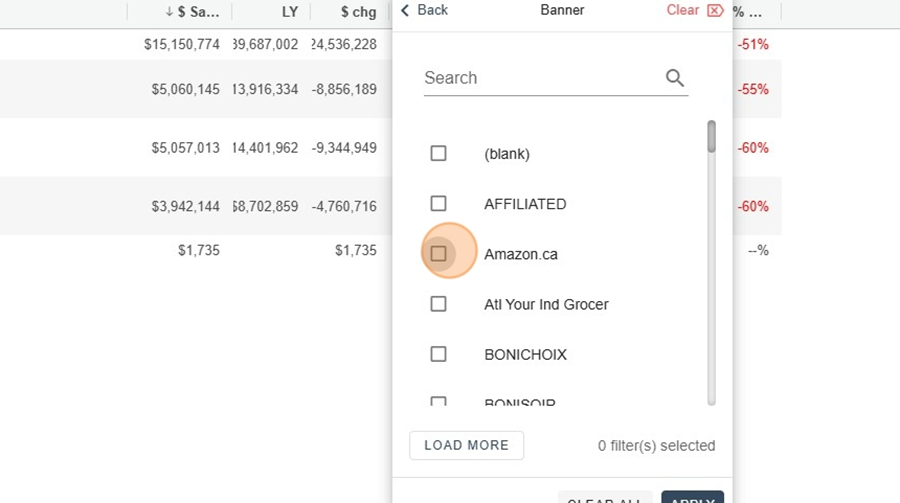
Click on apply
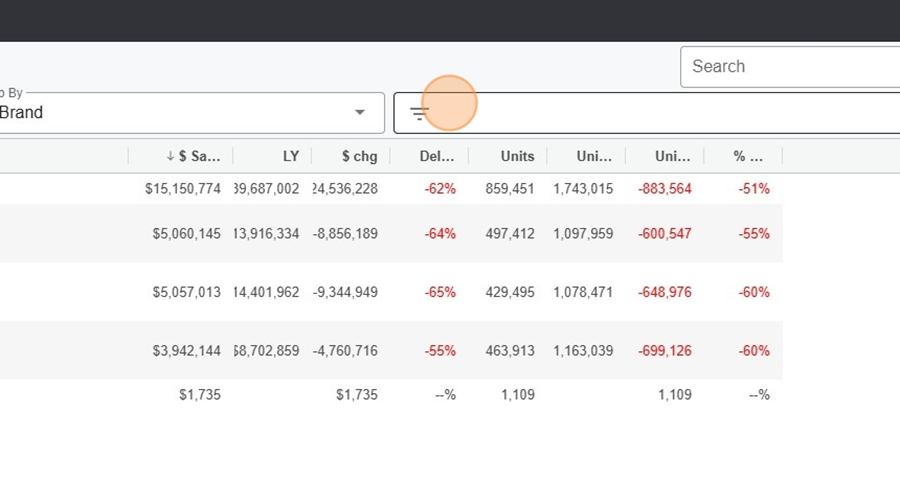
Data mining allows you to quickly access a finer granularity of information to better understand what lies behind a figure.
For example, we notice here a 62% decrease for the brand "Health and Co."

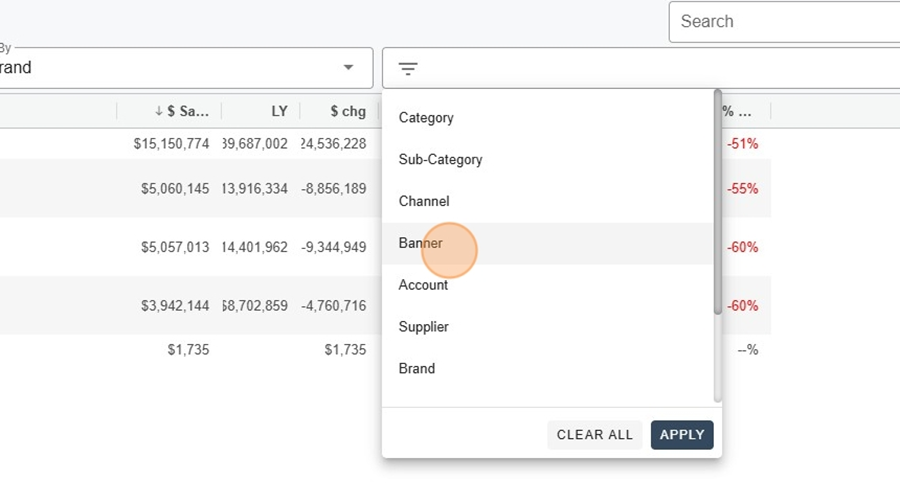
It is therefore easy to filter to understand where this decrease comes from, by selecting the filter option on the right.

Then select the desired category. Here, for example, we want to investigate whether a particular banner is the cause of this decrease.
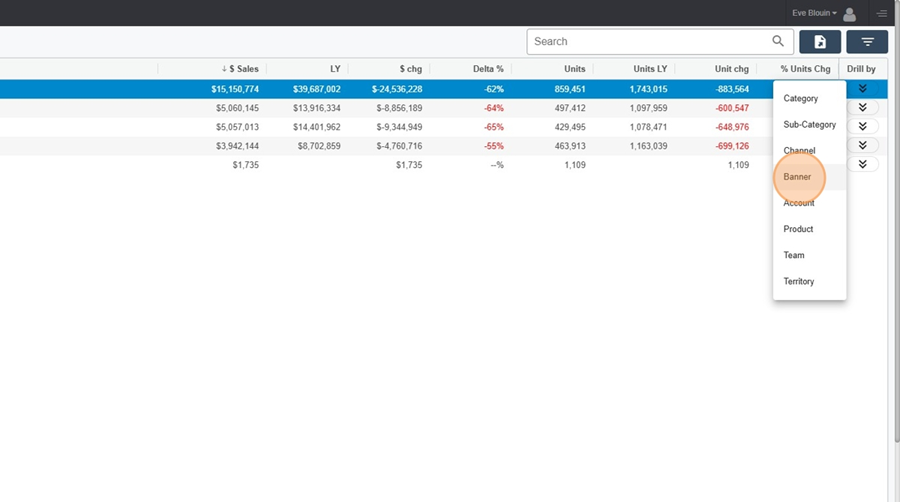
Once the faulty banners are identified, it is possible to investigate further by clicking again on the filtering option on the right. Here, for example, we would like to see the details of this figure by territory.
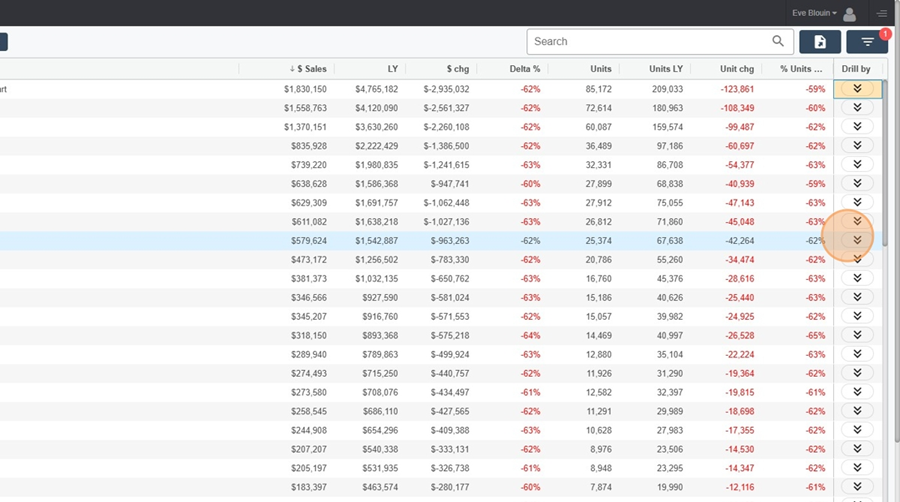
Select the desired category
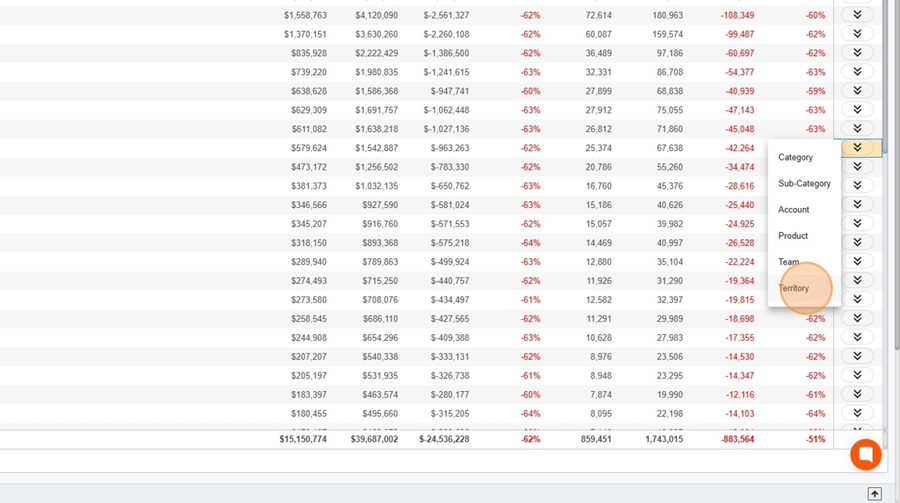
It is therefore possible to understand the details of a figure in just a few clicks. You can repeat these steps as many times as you like.
Detailed analysis of performance by banner: This report allows tracking sales by brand, making it easier to compare performance across different banners.
Tracking sales trends: Thanks to the percentage variation column, it is easy to identify banners that have experienced an increase or decrease in sales, which can guide strategic decisions.
Unit performance: By analyzing unit sales, the report helps understand the impact on sales volumes, not just in terms of value.
Quick decision-making: The easy-to-read format and key performance indicators (KPIs) such as dollar change and unit variation enable quick decision-making, particularly for adjusting marketing or inventory management strategies.
Visualization of year-over-year differences: The report highlights the differences between the current year and the previous year, helping to assess sales growth or decline.
In-depth data exploration: The "Drill by" feature allows drilling into specific dimensions, providing a more detailed and precise view to better understand the underlying factors of sales results.