Forecast accuracy indicators quantify the gap between the forecast and the actual demand, according to various complementary dimensions (article on lag and granularity) and address different business questions.
Each indicator provides a different perspective for comparing forecasts with actual sales results. Understanding these measures allows users to diagnose issues, adjust planning strategies, and make better business decisions.
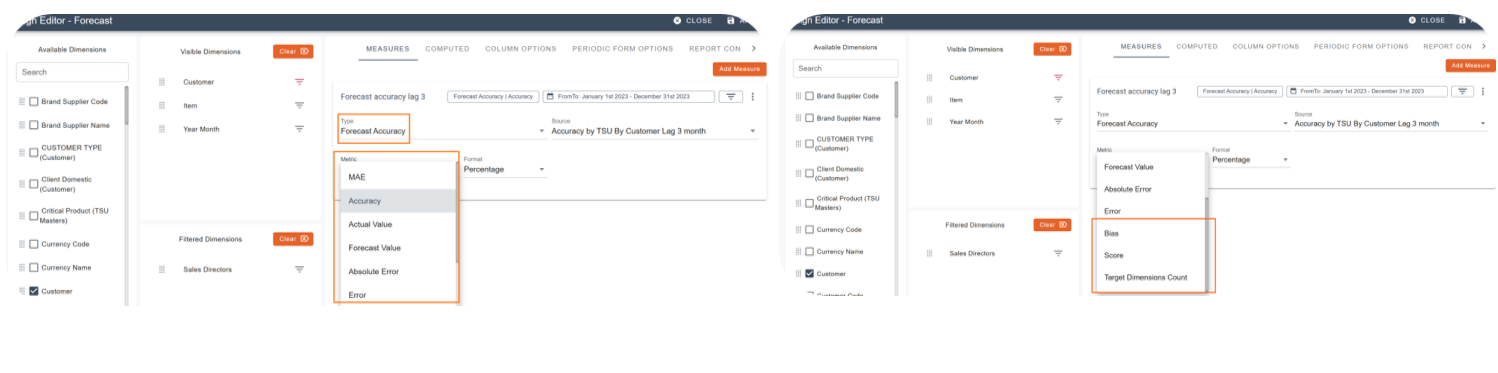
To evaluate and continuously improve forecast performance, Pawa includes several key indicators in its reports through the Forecast accuracy measure.
| Definition of the measure |
MAE (Mean Absolute Error)(%) |
The average absolute difference between forecast values and actual values. This indicator gives the typical size of the error, regardless of its direction. |
Accuracy |
An indicator showing how closely the forecast reflects the actual demand, calculated as Two calculations are available:
|
Actual value | The true value observed for the given period (e.g.: actual sales or stock usage). |
Forecast value | The reference forecast used for comparison, such as last year’s value, a baseline model, or a previous forecast. |
Absolute Error |
The absolute difference between the forecast and the actual value. It removes the sign to consider only the size of the error. |
Error |
The raw difference between the forecast and the actual value, keeping the direction of the error. |
Bias (%) |
The average of errors over time. A positive bias shows a tendency to overestimate, a negative bias shows that there has been underestimation. |
Score |
A composite score that combines the average magnitude of the error and its direction. |
Target dimensions count | The number of target dimensions indicates how many distinct combinations (products, customers, etc.) the forecast accuracy is evaluated on, based on the level of granularity selected for the calculation. |
The detailed indicators below correspond to the most commonly used forecast accuracy measures for analyzing forecast quality. The other values presented serve as a calculation basis or reference.
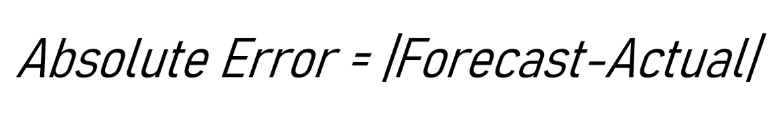
The absolute error measures the absolute error between the forecast and the actual demand, in units.
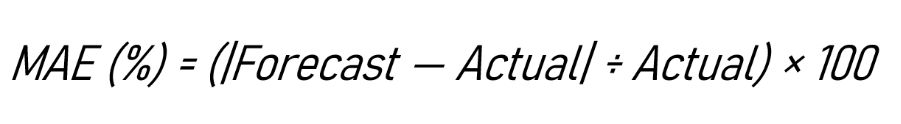
The MAE (%), also called WAPE, expresses the absolute error as a percentage of the demand.
It answers the following question:
“What is my relative error compared to the demand level?”
It allows to:
compare products or scopes of different sizes,
have a more synthetic and comparable view.


The Bias measures the direction of the forecast error.
It indicates whether the forecast is:
structurally too optimistic with a positive bias (over-forecast),
or too conservative with a negative bias (under-forecast).
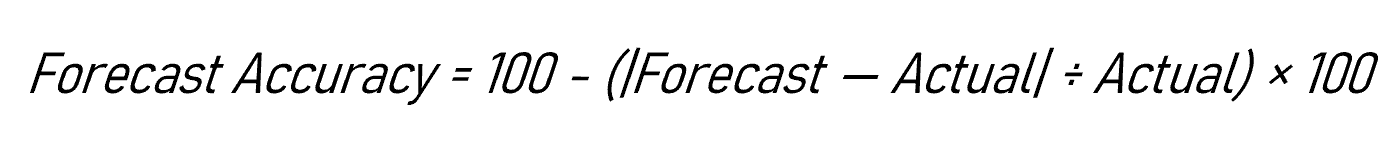
In Pawa, Accuracy is defined as:
Accuracy = 100 − MAE (%)
In other words, it corresponds to an inverted reading of the mean relative error (MAE(%)).
Value | Interpretation |
100 % | Perfect forecast |
90 % | Error equivalent to 10% of the actual value |
0 % | Error equivalent to 100% of the actual value |
< 0 % | Error greater than the actual volume |
This table illustrates the interpretation of Accuracy as an inverted measure of relative error: in contrast to the MAE(%), the higher the value, the closer the forecast is to the observed demand.
Moreover, Accuracy can take on a negative value when the error exceeds the entirety of the actual demand:
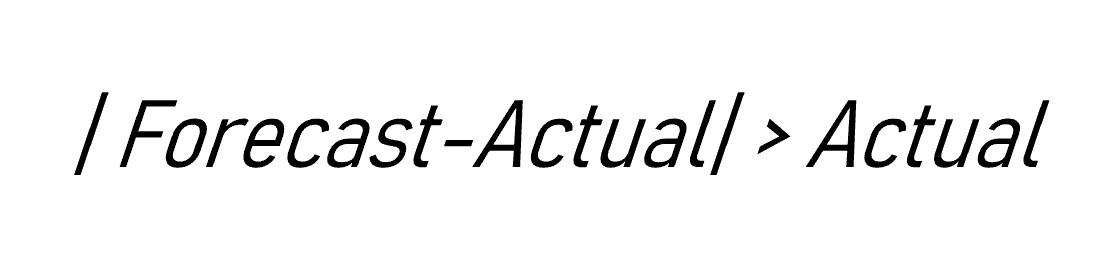
This is the direct consequence of the mathematical definition of the indicator, as illustrated below.
For example, a company forecast 250 units, whereas actual demand was only 100 units.
Forecast | Actual | Absolute error | Accuracy |
250 | 100 | 150 | −50 % |
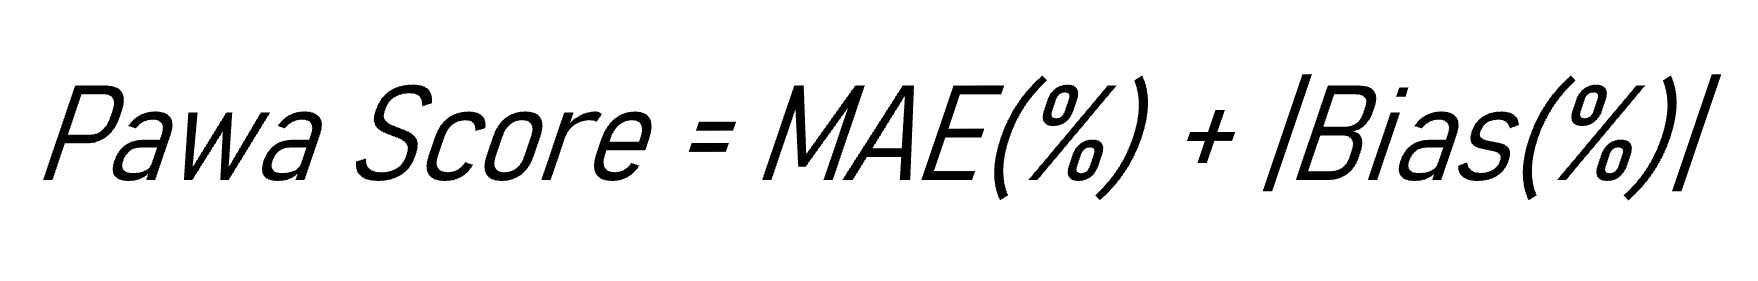
The score in Pawa is primarily used as an evaluation criterion to compare and optimize the forecasts produced by the models.
It combines the magnitude of the error and the forecasting posture by adding MAE(%) and Bias(%).
This is generally related to the level of granularity used to calculate accuracy.
When accuracy is assessed at a detailed level (by customer, by product, or by customer × TSU combination), each difference between the forecast and the actual demand is counted individually.
At this level, errors do not offset each other.
Conversely, accuracy calculated on an aggregated total can hide significant discrepancies, because over- and under-forecasts partially cancel each other out.
Example at customer level
A company has two customers:
Customer A
Forecast: 100
Actual: 150
Customer B
Forecast: 100
Actual: 50
In total:
Forecast = 200, Actual = 200 → total error = 0
Overall accuracy is excellent.
At customer level:
Each customer shows an error of 50 units.
Accuracy calculated by customer is low.
The business use-cases of forecast accuracy change depending on the granularity used.
At the total level, accuracy measures the overall consistency of the plan.
At a detailed level, it measures the ability to correctly forecast each actual flow.
The more detailed the level, the more demanding the measure becomes.
More granular accuracy indicates a truer representation of operational reality.
Low accuracy at a detailed level may indicate:
high demand variability,
heterogeneous customer behaviors,
or forecasting assumptions that are too global for this level of analysis.
This is often a starting point for refining segmentation, adjusting parameters, or reassessing the appropriate management level.
Forecast accuracy: a set of measures serving business decisions
Beyond a simple percentage, forecast accuracy supports a variety of decisions. This article offers a business-focused perspective and avenues for using the main forecast accuracy measures.
How to configure a forecast accuracy measure in Pawa
This article explains how to configure sales forecast accuracy in Pawa.
Demand Forecast Process - Monthly S&OP Cycle
This process guides the organization from an objective baseline forecast to an executive-approved plan.