Here we’ll see different ways you can set up a widget that shows a multi-chart diagram
For more info about setting up a Dashboard and different Widgets, check out this article:
Creating a dashboard and adding widgets
The multi-chart widget is great for showing lots of data in the same chart, in different ways.
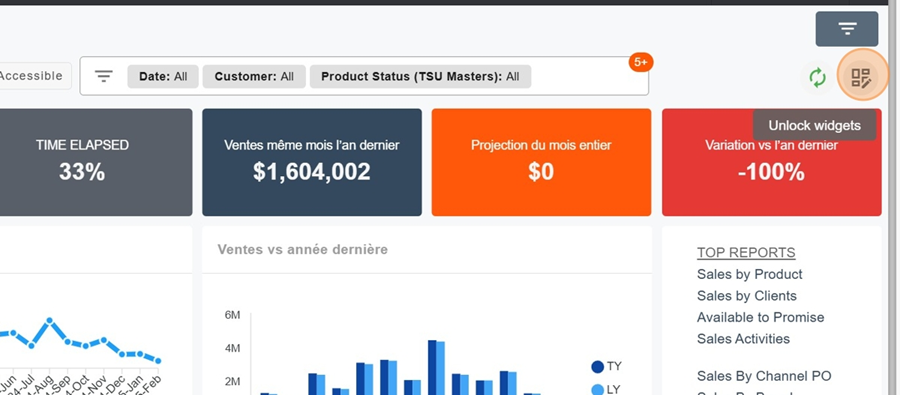
To add a widget, first click on the squares icon at the top right of the screen
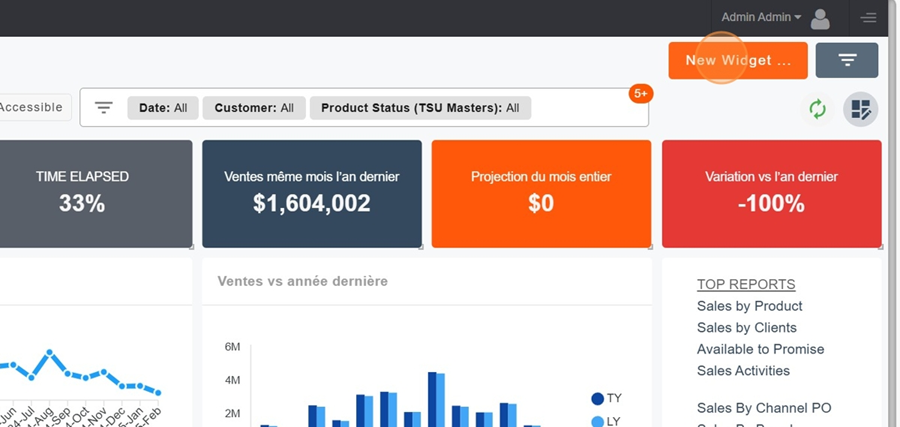
Then click on the orange box New Widget
Name your Widget.
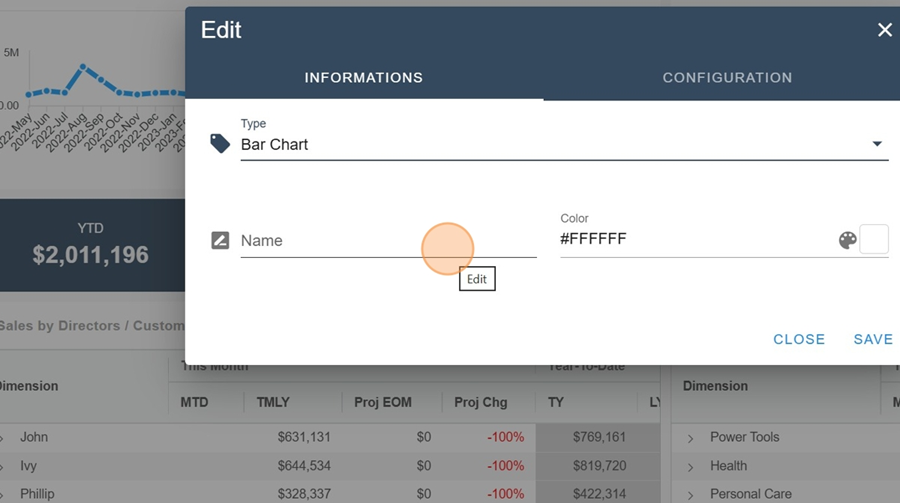
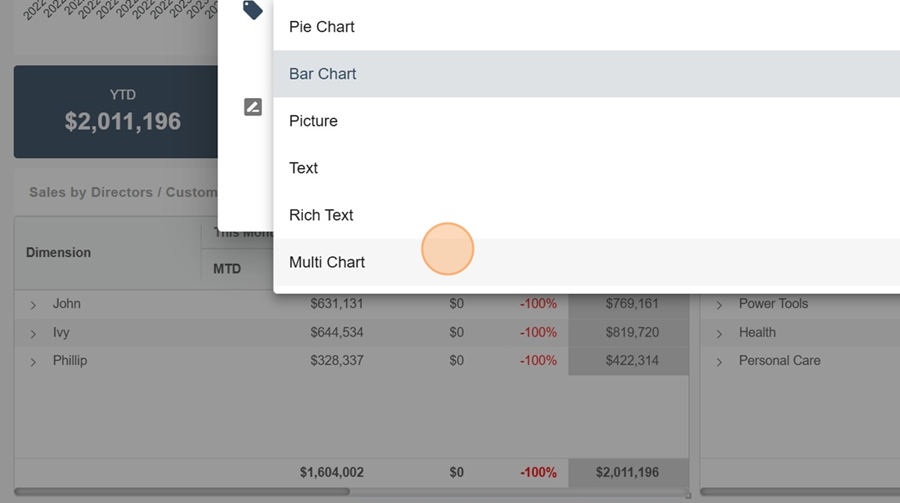
Select the multiple chart type in the info section
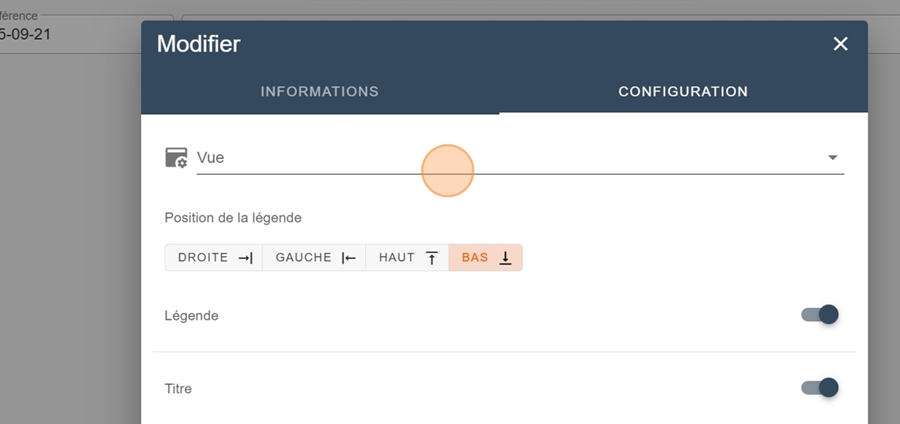
Go to the configuration section and pick your view
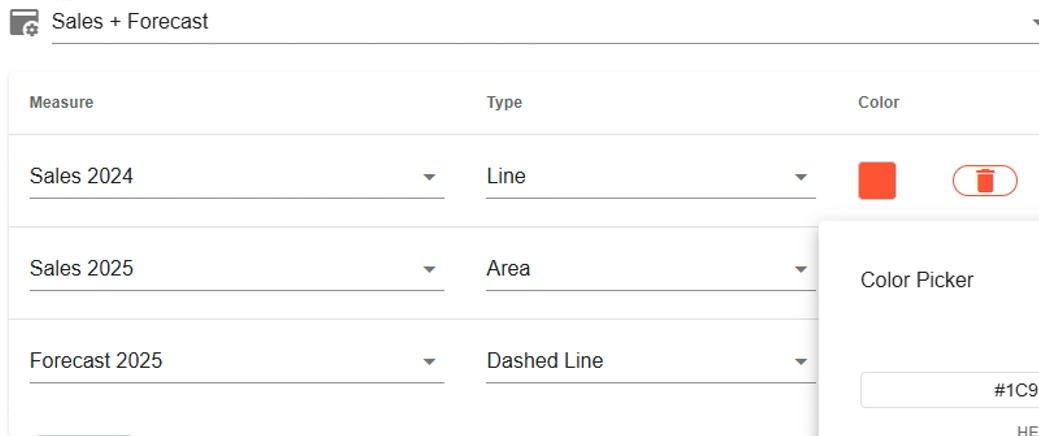
Next, pick the measures you want to show in your chart, along with types and colors for each one
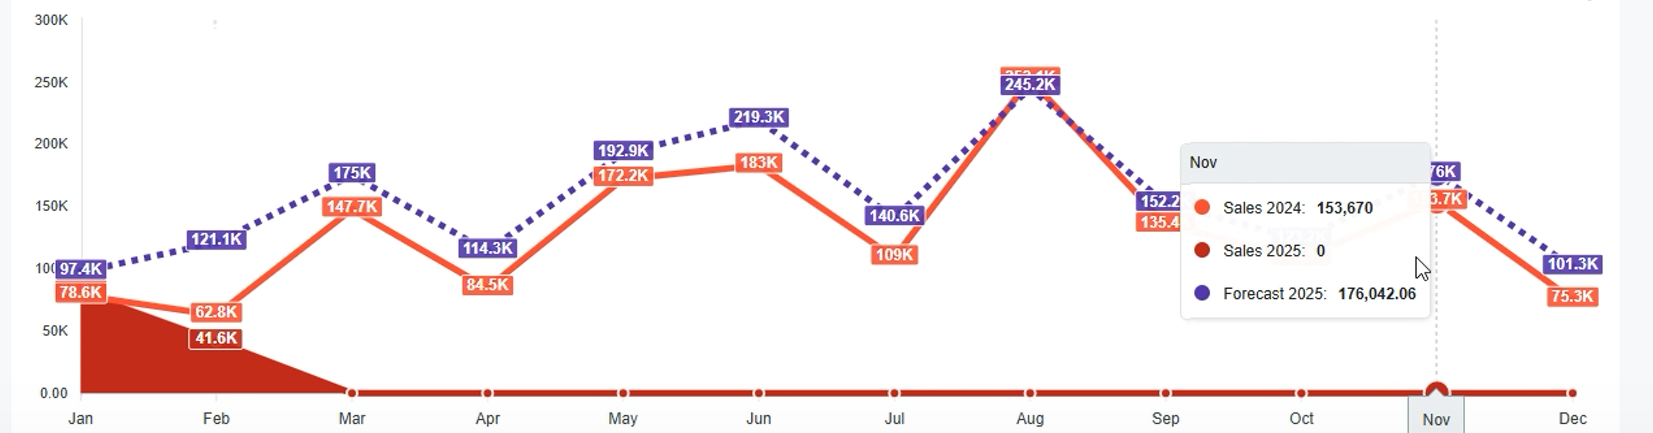
Then check out your chart
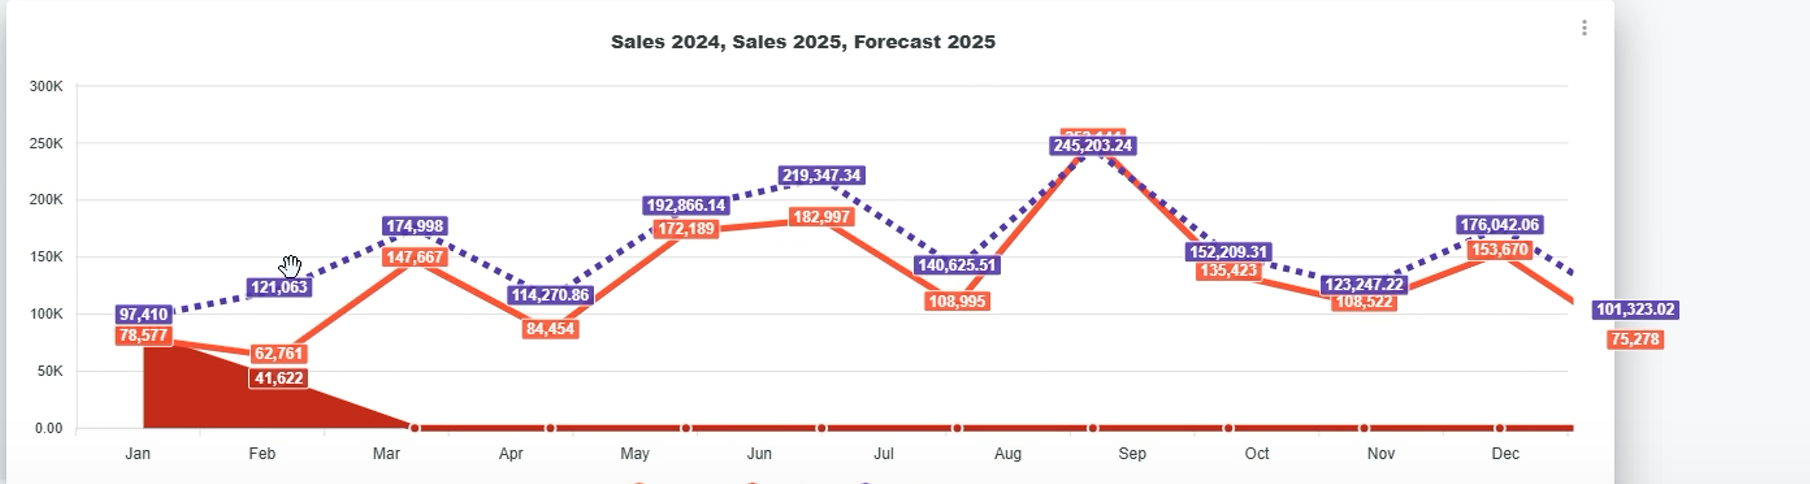

When you hover your mouse over the chart, the data will show up, like below