Go to the Reports section.
Click on Create a new report.
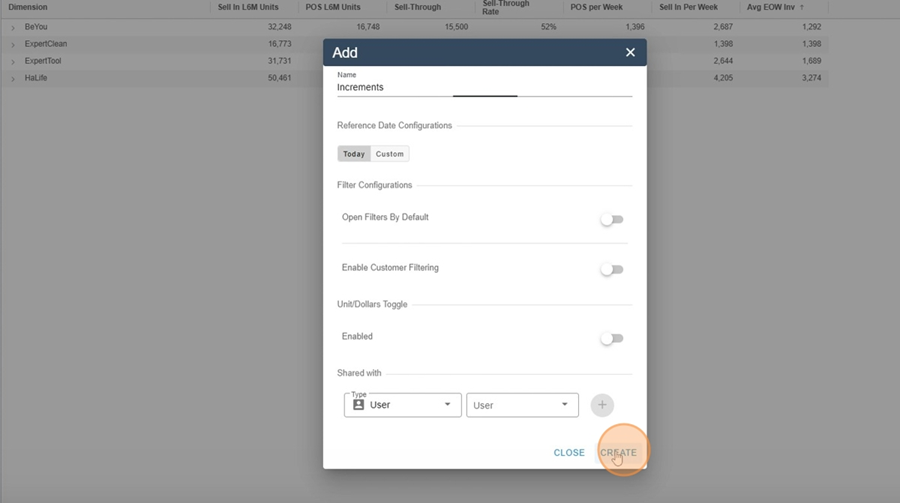
Name the report (e.g. Increments).
Save.
Open the Design Editor.
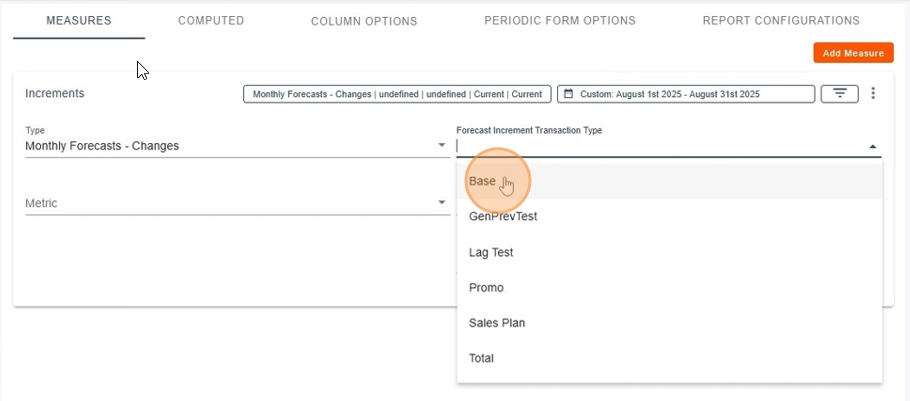
Click on Add Measure.
Select the measure Forecast Change.
Choose between:
Daily Forecast Change
Monthly Forecast Change
Select the forecast type (e.g. Base Forecast).
Pick how to display: Units or Dollars.
You can set the analysis horizon, for example the next 12 periods, the next 3, etc.
In our example, we'll only look at transactions and increments impacting the August 2025 period.
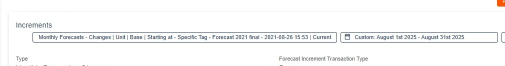
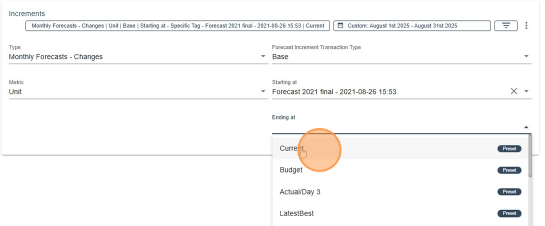
This step is all about choosing a freeze tag range, from a starting point to an end point, so you can view increments made during that interval.

Setup steps
Choose the freeze tag to start
• For example from a 2021 tag
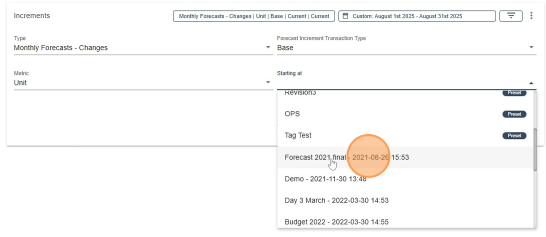
Choose freeze tag to finish:
Either a specific tag,
Or the current forecast (Current).
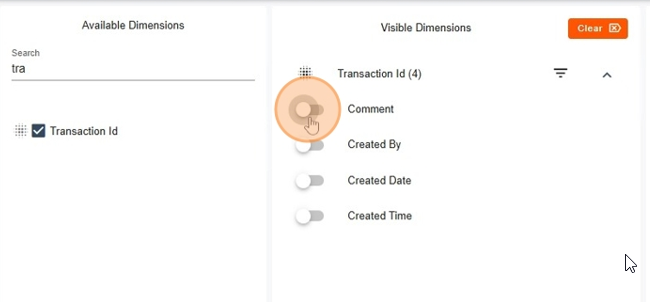
Add the Transaction ID.
Show:
Creation date,
Creation time,
The person who made the transaction,
The entered comment (if any).
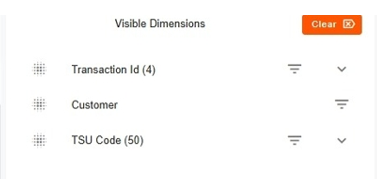
Optional : Add clients (Customer) and products (TSU Code).
Apply filters.
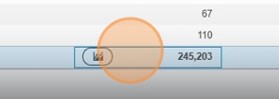
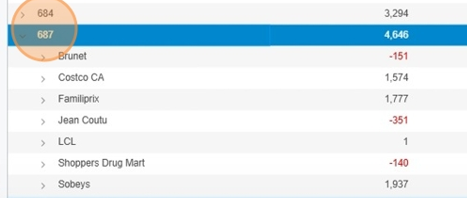
The report shows:
The list of all transactions that impacted the time interval,
The sum of increments (Units or Dollars),
Breakdown by customer/product.

Each transaction = a set of increments.
The forecast is the sum of all transactions from the beginning up to the chosen moment.