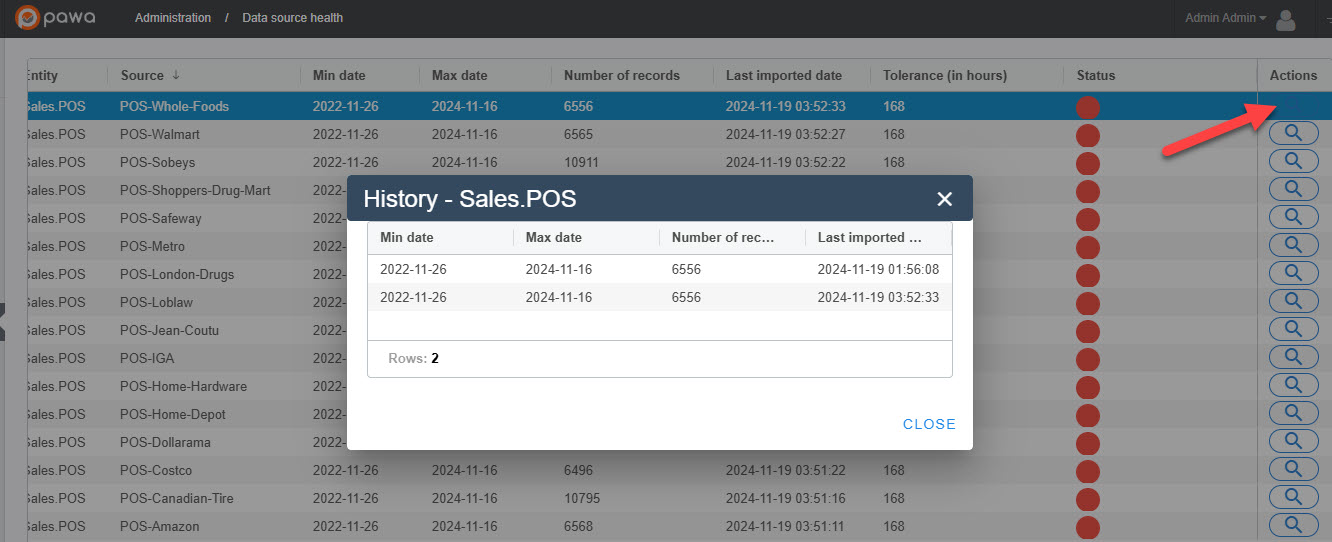
The Data Health feature allows you to easily compare the status of multiple data sources.
For example, if you have multiple point of sale (POS) data sources or diverse types of data, this page will help you ensure that all information is synchronized and up to date.
Objective: Have confidence in the data
To add a tolerance, enter in the Tolerance column the number of hours corresponding to the maximum acceptable delay to consider the source current. For example:
If your source should be updated daily, enter 24.
If the update is weekly, enter 168 (7 days × 24 hours).
To access the import history, click on the magnifying glass icon located in the Actions column. You'll be able to view detailed information about previous updates to this data source, such as:
Minimum and maximum dates of the imported dataset,
Number of records for each import,
Date of each import.

Data teams can quickly review the status column to identify issues.
Different tolerance levels can be defined based on the reliability or importance of each source.
Ensures data quality and completeness for downstream analysis and decision-making.
Min Date: Corresponds to the date of the oldest or smallest transaction recorded in the data (for example, 26 November 2022).
Max Date: Represents the date of the most recent or largest transaction recorded (for example, 16 November 2024).
Objective: Verifies there are no gaps in historical data, ensuring continuity and consistency in the time range covered.
The "Number of Records" column shows the data volume for each source.
Helps identify anomalies, such as unusually low or high data volumes.
The "Date of Last Import" indicates when the data was most recently received.
If data has not been received within the predefined tolerance window, the status becomes red.
Green: Data is flowing normally and is within the tolerance window.
Red: Data is delayed or encountering issues.
Magnifying glass icons: Allow users to closely examine the history of each data source.