You can now manage several types of forecasts in Pawa. To make the interface simpler, we’ve made the forecast measures selector better.
In the following example, we’ll have three types of forecasts:
So-called basic (baseline) forecasts
Promotional forecasts (promo)
Forecasts according to the sales plans (budget)
It’s important to really get the difference between these types of forecasts, because each one actually stands for a different kind of data.
Now you need to pick: Monthly forecast.
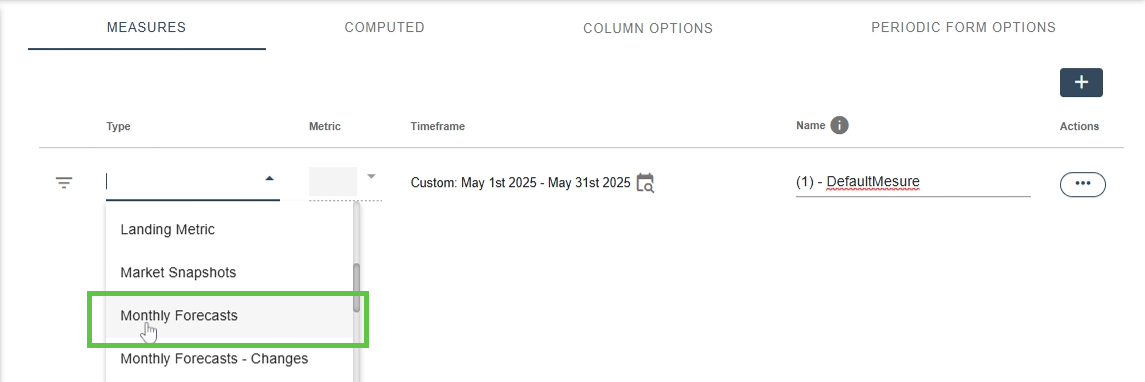
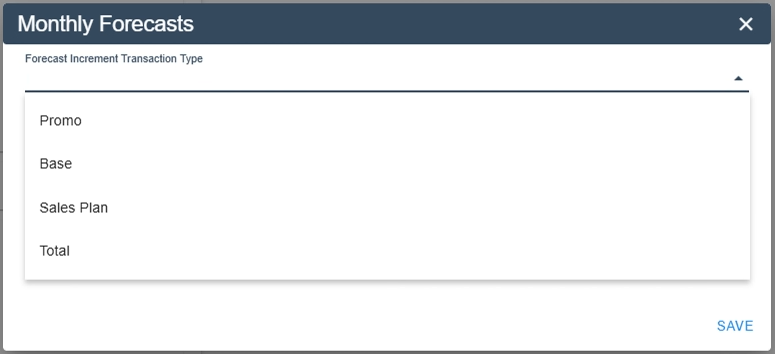
It's in this context menu that the magic happens: you can now select the type of forecast you want from the dropdown menu.
In this example, you've got four choices: Promo, Base, Sales Plan and Total.
The Total option gives you the sum of all the forecasts (Promo + Base + Sales Plan).
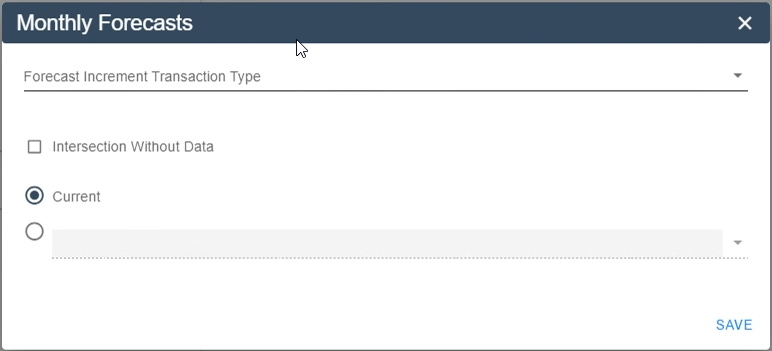
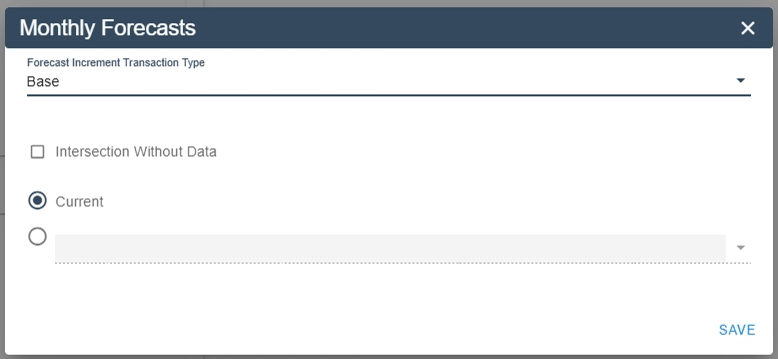
So, to show the current value for the forecast type “Base” you need to pick this:

The previous option showed all intersections where a price was set. If you also want to show intersections that don’t have a price (like a new product or a new customer), just check Intersection Without Data. (Previously called Current All)
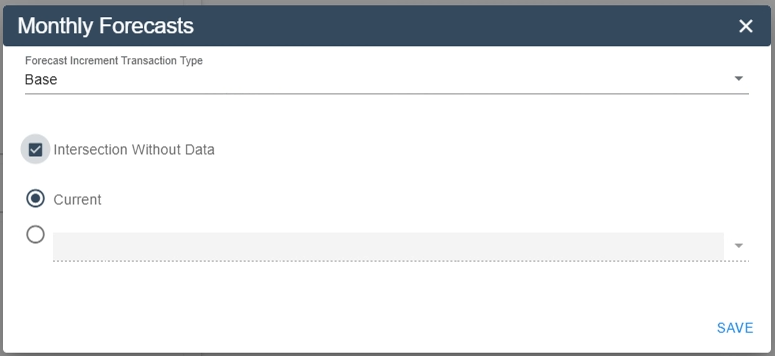
If you want to show values like they were at a specific point in the past, you can do this by picking the option under Current. You’ll then be able to pick the latest tags for each type, like: Budget, Actual/Day3, LatestBest, Revision1, Revision2, Revision3. (These used to be options like Base - Latest Budget, for example.)
If you want to view even older values, like for example the 2023 Budget, you can just pick the Forecast Tag that matches the date you want.
(What we used to call a Forecast Tag.)