Seasonality analysis helps identify recurring sales patterns over time, allowing for more accurate forecasting. By grouping similar products and customers into clusters, you can better understand demand fluctuations and adjust inventory, promotions, and purchasing decisions accordingly.
Go to Administration > Configurations (Forecast).
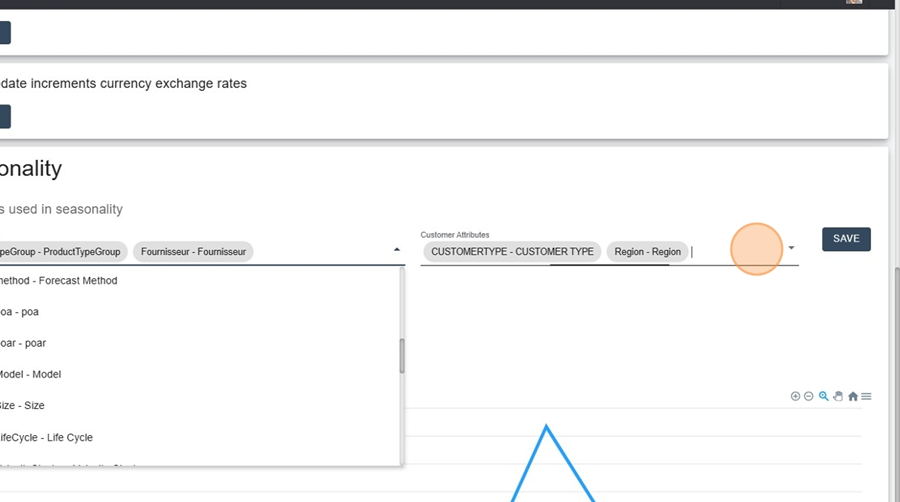
Scroll down to TSU Attributes and select the attributes you want to use for clustering.
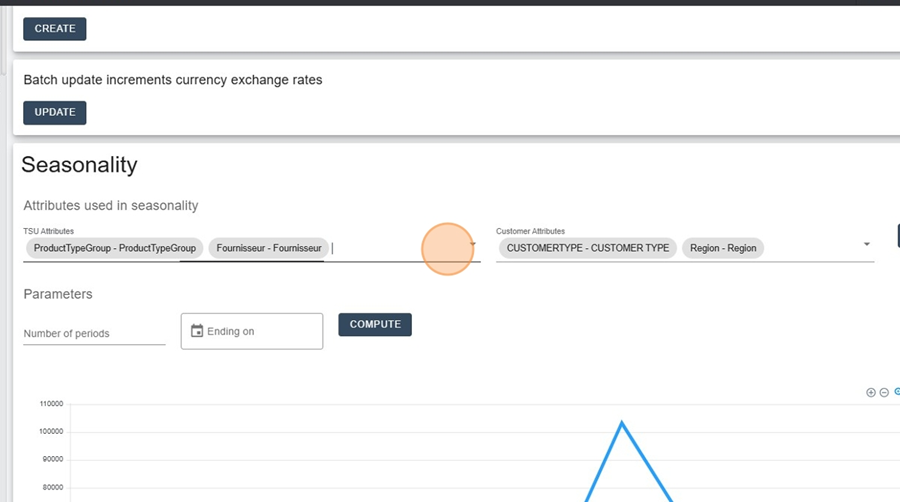
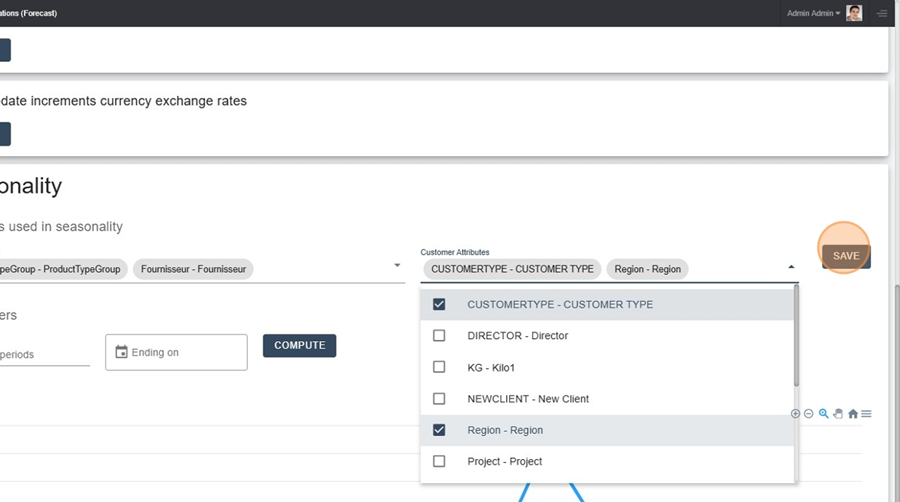
Do the same for Customer Attributes.
Click Save, then confirm by clicking OK.
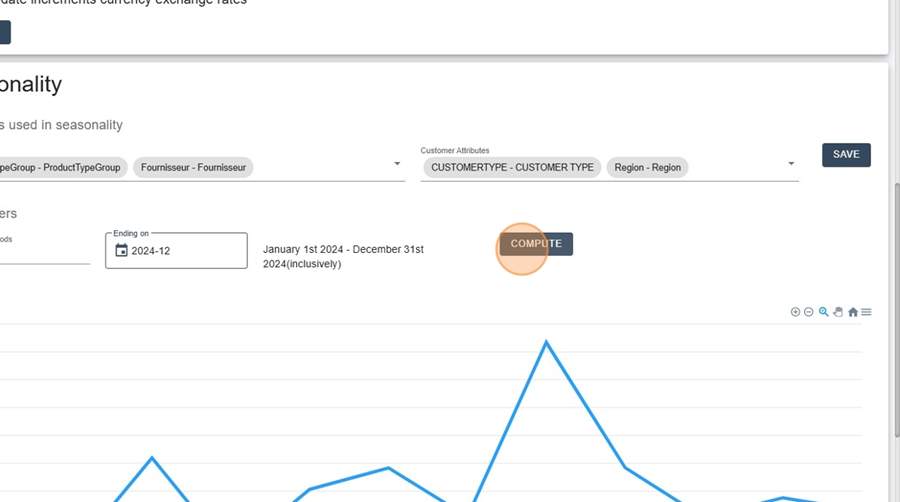
Choose the Number of Periods to calculate the seasonality weight. The minimum is 12 months. If you select 24 months, the system will calculate the average for each month over that period.
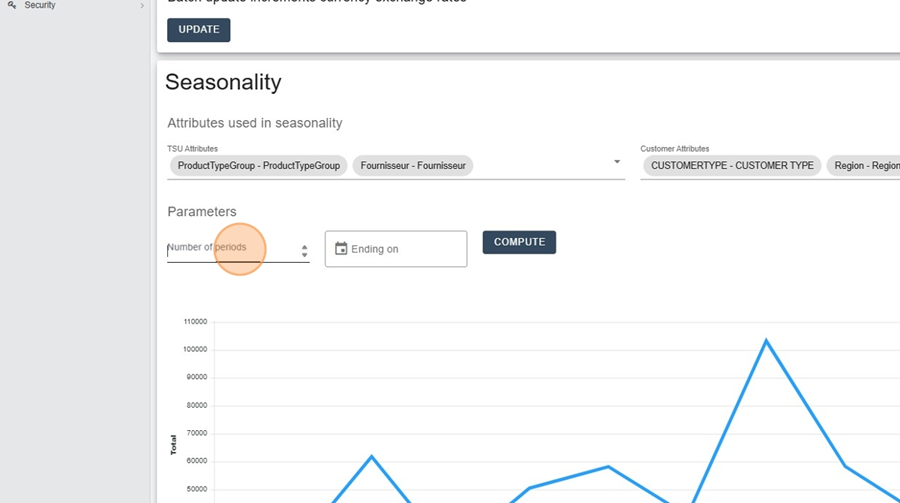
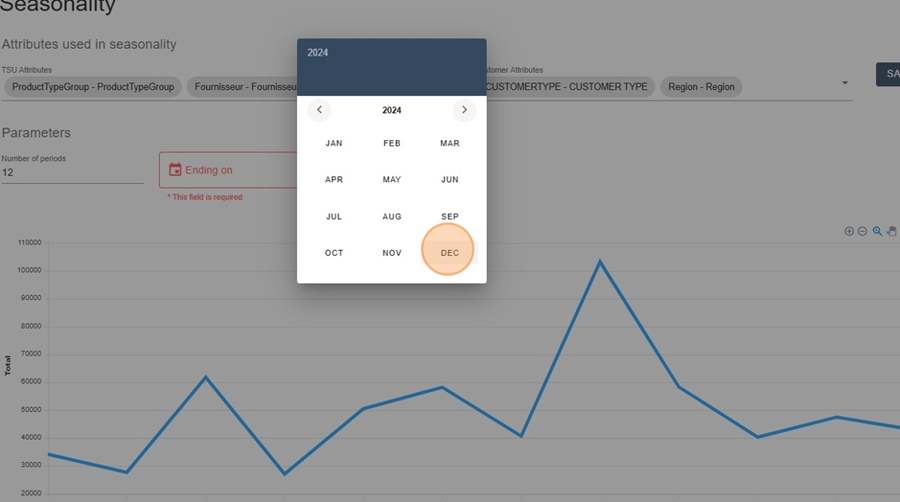
Select the latest completed period with sales data (do not choose the current period).
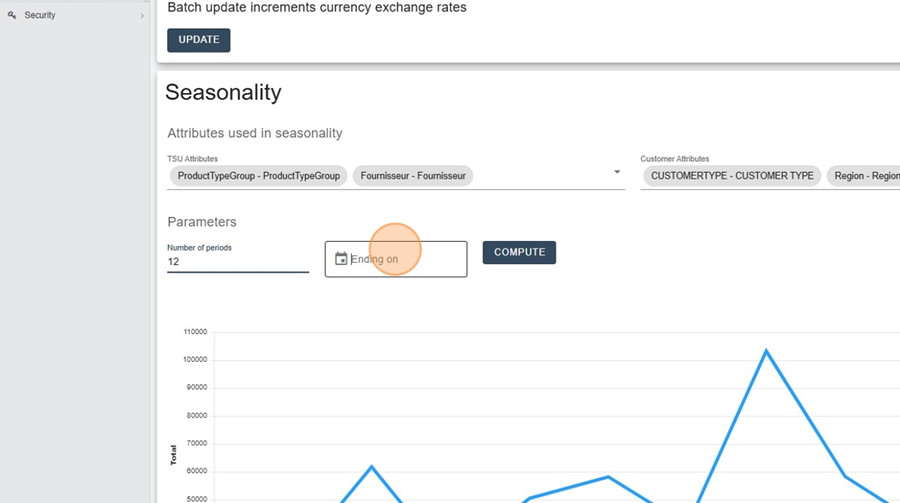
Choose the last completed month you want to use.
Click Compute to generate the seasonality curve.
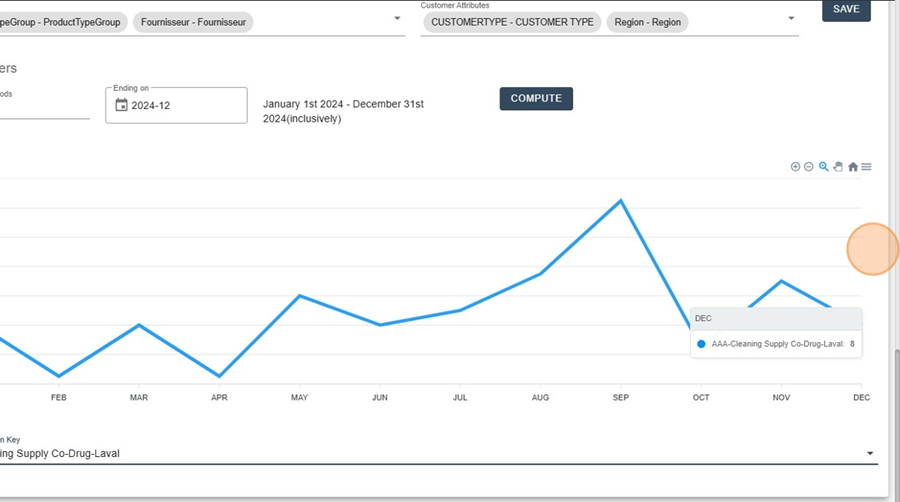
Review the results to check if the clusters make sense. Use the Filter by Season Key field to explore specific clusters.
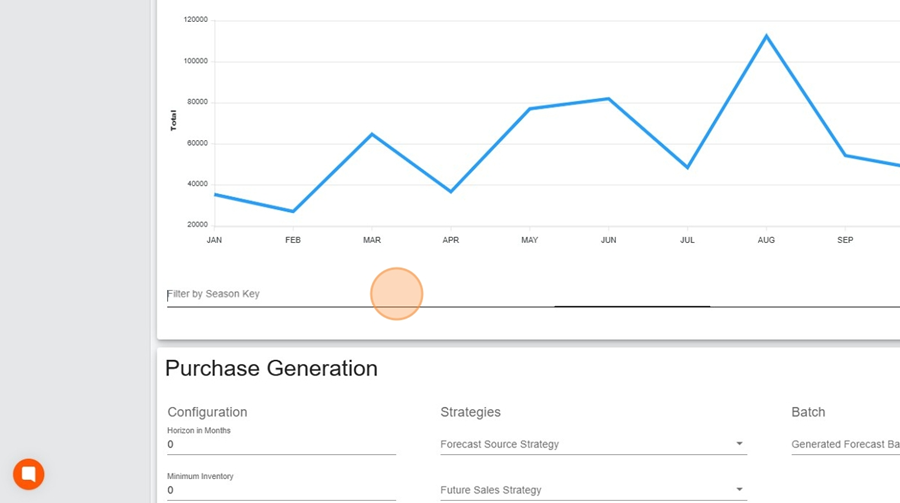
For example, selecting "AAA-Cleaning Supply Co-Drug-Laval" will display its seasonality curve over one year.
Selecting the right TSU and Customer Attributes ensures that seasonality patterns reflect real sales trends. If the clusters are too broad or don’t group similar products and customers, the forecast may be inaccurate, leading to poor purchasing and stock decisions.
Use meaningful attributes: Group products and customers based on factors like category, location, or sales channel.
Ensure data consistency: Verify that your selected period includes a full sales cycle to avoid misleading trends.
Test different clusters: Compare results across multiple clustering approaches to refine accuracy.
Avoid over-segmentation: Too many small clusters may lead to unreliable trends due to insufficient data.
It’s important to manually recompute the seasonality (Step 8) whenever:
A new completed month is available.
There are significant changes in sales patterns (e.g., new product launches, major promotions, or shifts in customer demand).
The number of periods used for calculation is adjusted (e.g., switching from 12 months to 24 months).
Regularly updating seasonality ensures that the forecast remains accurate and reflects the latest sales trends.