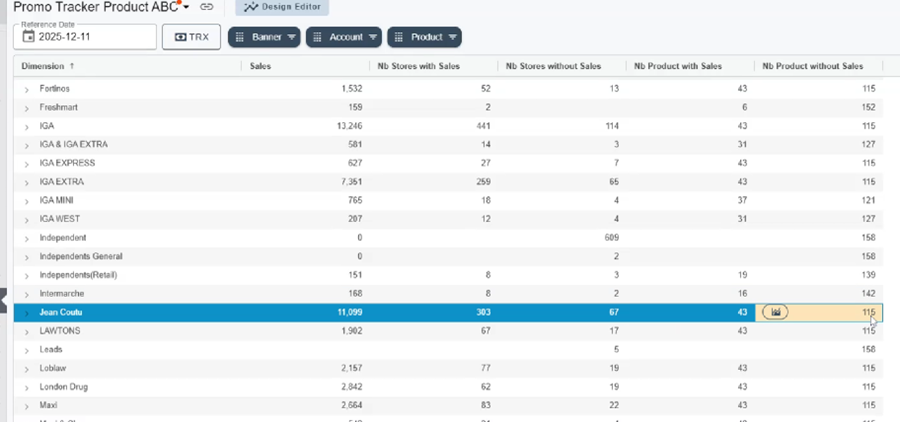
By adding certain metrics to your report in the design editor, you will be able to display the equivalent of a global distribution report.
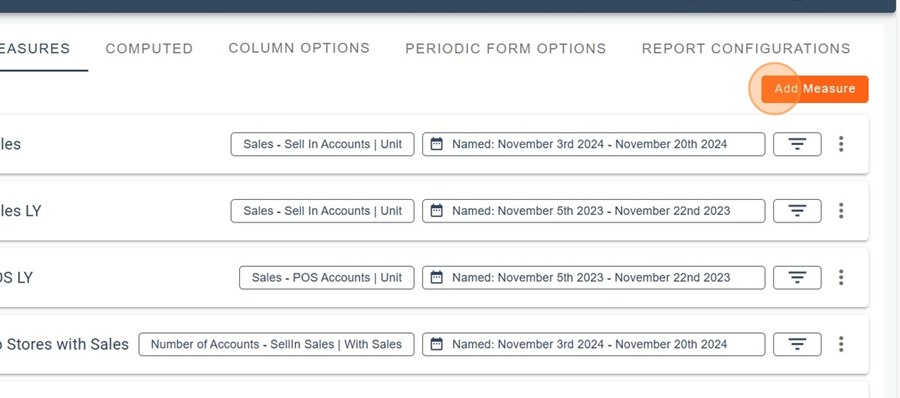
Let’s start by adding a new metric. For example, in this case, we want to see the number of stores without sales. Simply add the title, then select the type and the unit.
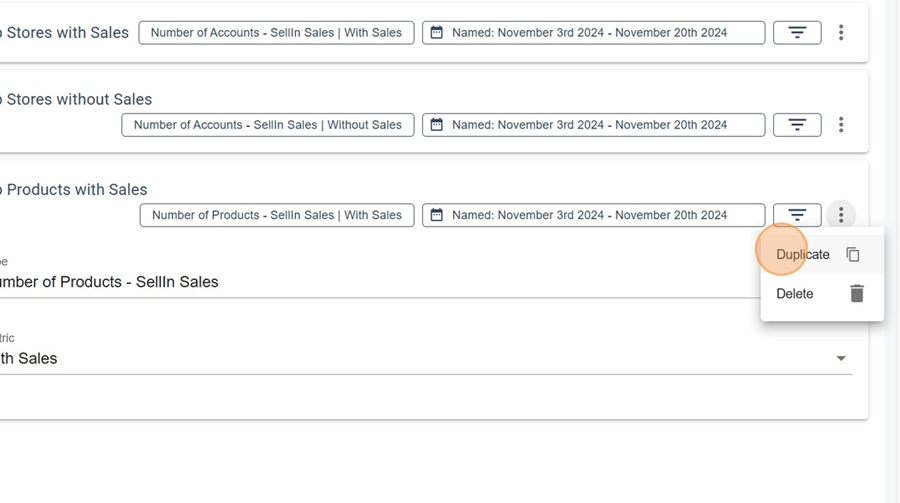
To add additional metrics, click on the three dots at the end of one of the existing metrics and select Duplicate.
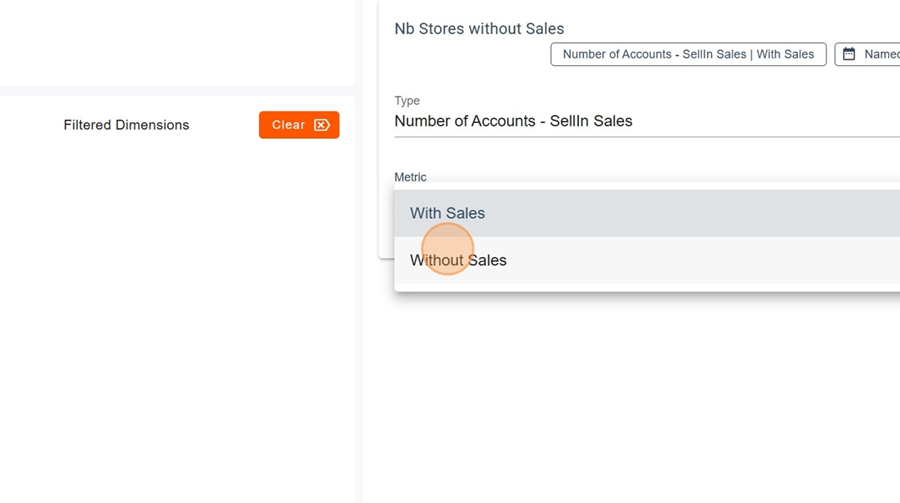
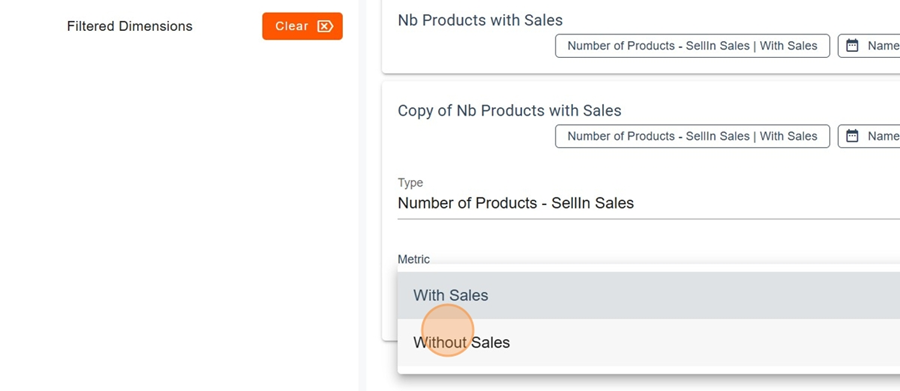
Then adjust the name, the type and the unit as needed.
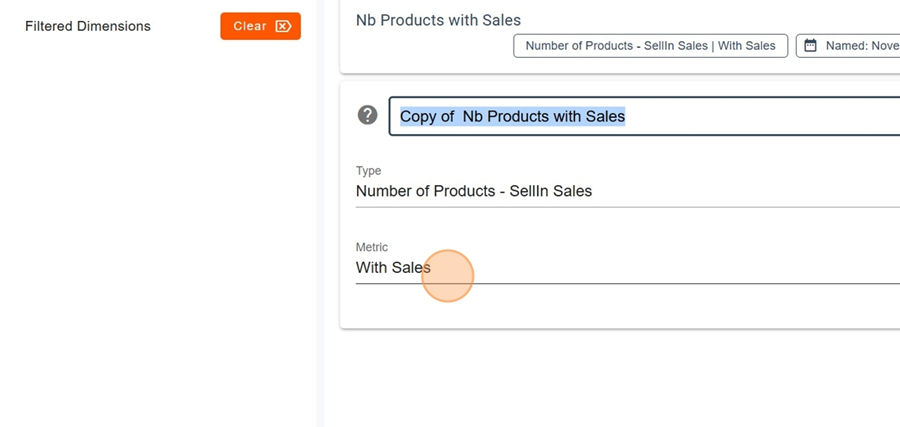
In this example, we want to compare the number of products with sales versus those without sales. We therefore created one metric for each option.
Please note that these comparisons between metrics are available for Sell-in and POS.
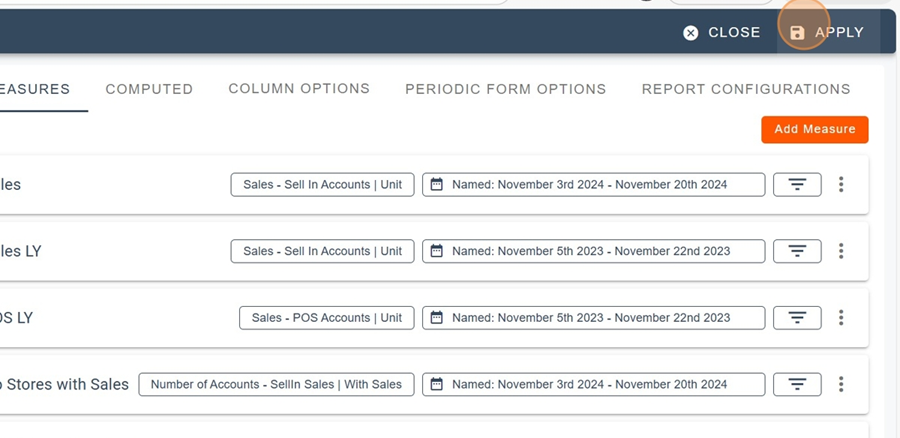
Once all the metrics have been added, click Apply in the top-right corner.
You will then be able to easily view the equivalent of a global distribution report. In this example, we can see that Jean Coutu, within the time frame shown in the top-left corner, recorded 11,099 units sold. A total of 303 stores had sales, while 67 stores had no sales. We can also see 43 products with sales versus 115 products without sales